INTRODUCTION
Contemporary economic geography seeks to understand the reasons for and consequences of the concentration of economic and demographic activity across space. Drawing on the pioneering contributions of Krugman (1991, 1992) and Brakman et al. (2009), it has been established that accumulation processes are responses both to centripetal forces, such as market accessibility, infrastructure, and economies of scale, and to centrifugal factors, specifically land costs, congestion, and environmental constraints. This interaction reveals the unequal organization of territorial development and persistent regional disparities, particularly in peripheral or developing economies.
In the Ecuadorian case, the territorial system of the economy demonstrates a marked concentration of population and Gross Value Added (GVA) in a few provinces, especially Guayas and Pichincha, which function as poles of productive, institutional, and demographic development. In contrast, vast areas of the Amazon region and the southern highlands exhibit low population densities and limited economic dynamism. This duality reflects a historically centralized growth model that has reproduced spatial inequalities even in contexts of economic expansion.
The 2015–2023 period allows us to examine the evolution of these asymmetries. Throughout these years, Ecuador underwent structural processes resulting from the exhaustion of the commodities cycle, fiscal instability, and the persistent effects of COVID-19. These processes not only reshaped the sectoral composition of production and employment but also the spatial distribution of economic activity, affecting provinces differently depending on their productive adaptive capacity and their integration into human networks.
The main contribution of the study lies in the empirical updating of the territorial analysis for the period following the commodities crisis and the COVID-19 pandemic, providing recent evidence on the persistence of spatial inequalities in Ecuador.
In this context, it is relevant to examine how production and population are territorially distributed throughout the country and whether these dynamics reproduce the concentration patterns described in the regional economics literature.
Research Objective
The objective of this study is to analyze the spatial distribution of production and population across the provinces of Ecuador during the 2015–2023 period, with the purpose of identifying patterns of territorial concentration and the persistence of regional inequalities within the national economic structure. Specifically, the study seeks to:
- Examine the evolution of the provincial distribution of Gross Value Added (GVA) and population throughout Ecuadorian territory.
- Identify the existence of patterns of economic and demographic concentration in specific provinces.
- Analyze the persistence of the core–periphery model in the country's territorial structure.
- Provide an empirical basis for future formal measurements of territorial inequality through indicators such as the Gini index or Lorenz curves.
THEORETICAL FRAMEWORK
The New Economic Geography (NEG) has extensively studied the spatial concentration of economic activity, maintaining as its main premise that the territorial distribution of population and production is not random, but rather results from economic forces that generate agglomeration and regional disparities. As Krugman (1991, 1992) argues, the combination of economies of scale, transportation costs, and factor mobility tends to favor the formation of territorial centers with greater economic density. Along similar lines, Torres & Ahumada (2022) point out that core economies concentrate strategic production processes with higher value as a result of technical progress, while peripheral areas remain subordinated to the structural lag present in specialization, generating less value. These core regions attract new activities, unlike peripheral territories, which experience persistent lags.
Likewise, Myrdal (1957) emphasizes that the aforementioned inequalities are not temporary; rather, they are the result of processes of cumulative causation, in which provinces with initial advantages attract more investment, innovation, and employment, while those with lower capacity remain underdeveloped. In addition, Hirschman (1958) reveals that productive linkages tend to concentrate in a limited number of development poles, thereby reinforcing territorial divergence.
In this regard, Gross Value Added (GVA) is understood as the macroeconomic indicator that measures the value added generated by each sector or industry in the production process of final goods and services in an economy over a given period of time and within a specific area. It serves as the basis for estimating gross domestic product and expresses a nation's economic growth by reflecting the real increase in the production of goods and services. In Ecuador, the study of GVA is of great importance, given that it reflects the actual economic evolution of each sector and province in terms of productive development.
GVA is important for identifying differences in productive capacity and economic specialization among different regions and provinces. It enables the analysis of regional competitiveness, the concentration of economic activities, and the connections among productive sectors (Salinas Campuzano et al., 2021).
Since the 1970s, the Ecuadorian economy has experienced growth marked by dependence on raw material exports, particularly oil. During the 1970s, driven by the oil boom, the country achieved an average growth rate of 2.2%, sustained by domestic consumption and gross capital formation (Brito, Sotomayor, & Apolo, 2019). However, the decline in crude oil prices in 1978 and the economic crises of the 1980s and late 1990s, exacerbated by the El Niño phenomenon and the financial collapse of 1999, led to a significant deterioration in production.
Beginning in 2000, with dollarization and greater trade openness, Ecuador regained its economic dynamism. According to Brito, Sotomayor, & Apolo (2019), exports, investment, and consumption drove average GVA growth of 4.6% between 2000 and 2009, generating a reconfiguration of the productive apparatus.
Cabrera & Muñoz (2019) state that structural asymmetries exist within the economic system, in which certain territories concentrate production, capital, and innovation, while others remain subordinate to extractive or low-value-added functions.
In Ecuador, economic leadership became consolidated in Pichincha and Guayas, provinces that concentrated the largest share of the national Gross Value Added and population, revealing a centralized and unequal productive structure in contrast to peripheral regions such as the Amazon (Sotomayor, 2019). These findings reaffirm the persistence of the core–periphery pattern identified by Salinas Campuzano et al. (2021), in which Pichincha and Guayas accounted for approximately 51% of the national GVA.
On the other hand, spatial distribution constitutes an essential element for understanding the territorial organization of economic activity. From the perspective of New Economic Geography, demographic concentration is not the product of chance; rather, it is the result of cumulative processes in which regions with initially high levels of urbanization, infrastructure, and employment absorb new waves of population, thereby reinforcing their centrality (Krugman, 1991; Myrdal, 1957). Consequently, population operates as a strategic variable: determining market size, conditioning the location of investments, and reproducing persistent inequalities between more densely populated territories and low-density areas, such as the Amazonian provinces, where accessibility and dispersion costs constitute a barrier to economic dynamism.
These dynamics are particularly evident in the Ecuadorian case; as Sotomayor-Pereira (2019) points out, the country's demographic structure results from a core–periphery pattern in which Guayas and Pichincha concentrate both population and productive activity, while numerous regions of the Amazon and parts of the Highlands exhibit minimal population densities, despite their extensive land area. This asymmetry implies that recent population growth, particularly between 2015 and 2023, has deepened territorial polarization, given that provinces more integrated into urban networks continue to expand, while peripheral ones remain characterized by limited growth. Therefore, provincial analysis not only facilitates the description of demographic trends but also contributes to understanding the persistence of structural territorial disparities in the Ecuadorian economy.
Sotomayor-Pereira (2019) demonstrates that both production and population have tended to concentrate in provinces of the “core,” leaving the productive population more dispersed in the periphery, which reinforces the thesis of a core–periphery dynamic in the country's economic geography. As Lechuga and Vera (2024) point out, prior to the pandemic, the most advanced economies generated approximately more than 40% of the world's GDP, accounting for around two-thirds of global exports, while peripheral economies, representing approximately 85% of the population, contributed a significantly smaller share of global trade.
In recent years, the literature on territorial inequalities has strengthened the analysis of economic concentration from a spatial perspective. Contemporary studies indicate that agglomeration processes continue to intensify even in developing economies, generating persistent regional disparities between core and peripheral territories (Rodríguez-Pose, 2018; Iammarino, Rodríguez-Pose & Storper, 2019). These dynamics reflect the tendency of productive activities to locate in territories that concentrate infrastructure, human capital, and connectivity, thereby reinforcing the cumulative effects of regional development. In the Latin American context, recent research shows that territorial inequalities continue to be a structural feature of the region's economies, where a small number of metropolitan areas concentrate the majority of production and formal employment.
In the Ecuadorian case, these dynamics are clearly evident; since 1970, the Ecuadorian population has increased from approximately 6.1 million to more than 18 million in 2022 (INEC, 2022), with a strong redistribution toward urban areas and provinces characterized by significant economic dynamism. However, this growth has occurred unevenly, as the provinces of Guayas and Pichincha, which concentrate the country's main urban centers, have attracted an increasing proportion of both population and productive activity. Querales and Chirinos (2022) address the cause of this phenomenon, arguing that the industrialization process was late, which allowed the more advanced economies to consolidate their dominance over peripheral states, establishing a structure in which production and technical development generating greater value accumulated in certain regions.
Thus, the evidence suggests that the economic structure and demographic distribution have developed jointly toward increasing spatial polarization, demonstrating both historical processes and new productive and urban dynamics.
Territorial Inequality Indicators
With the purpose of strengthening the analysis of the spatial concentration of economic activity, the study proposes the incorporation of indicators widely used in the regional economics literature. Among these, the territorial Gini index and the Lorenz curve applied to the distribution of Gross Value Added stand out.
The Gini index is one of the most widely used measures for evaluating inequalities in the distribution of economic variables. In the territorial context, this indicator makes it possible to estimate the degree of concentration of Gross Value Added among the different provinces of the country. Its value ranges from 0 to 1, where values close to zero indicate an equitable distribution, while values close to one reflect a high degree of economic agglomeration in a small number of territories (World Bank, 2020; OECD, 2022).
The Lorenz curve makes it possible to graphically represent the degree of territorial inequality in the distribution of production. This instrument compares the cumulative distribution of GVA among provinces with a line of perfect equality. The greater the distance between the two curves, the higher the level of economic concentration.
This type of representation is widely used in studies of economic geography to analyze spatial inequalities and processes of productive agglomeration (Iammarino et al., 2019; Rodríguez-Pose, 2018).
MATERIALS AND METHODS
This study adopts a quantitative, descriptive, and comparative approach aimed at analyzing territorial patterns of economic and demographic concentration in Ecuadorian provinces during the 2015–2023 period. The research is based on the use of secondary data from official sources, such as the Central Bank of Ecuador (BCE) for Gross Value Added (GVA) statistics, and the National Institute of Statistics and Censuses (INEC) for population and area data.
The data were organized and systematized at the provincial level using annual statistical series. Relative indicators were constructed, such as the proportions of GVA and population relative to the national total, temporal variation rates, and GVA/population/area ratios. For visual analysis, line graphs, comparative tables, and basic cartographic representations were used, making it possible to identify spatial dynamics and persistent asymmetries in the distribution of production and population.
The analysis was structured at two levels: a synchronic level, to compare distributions in specific years, and a diachronic level, to observe their evolution over time. A specialized literature review on economic geography, New Economic Geography, and regional development made it possible to contextualize the findings within the conceptual frameworks of territorial concentration, agglomeration economies, and core–periphery dualism. This theoretical and operational framework made it possible to contrast the empirical results with the main academic contributions on spatial inequality in developing economies.
Based on the theoretical framework of New Economic Geography and the core–periphery model, the following exploratory hypotheses are proposed:
· H1: Economic production in Ecuador exhibits a pattern of territorial concentration in a small number of provinces.
· H2: The spatial distribution of the population follows a pattern similar to that of economic activity, reinforcing agglomeration dynamics.
· H3: Provinces with greater economic dynamism coincide with those that concentrate infrastructure, urbanization, and administrative functions.
The empirical analysis is grounded in the principles of New Economic Geography, which posits that the concentration of productive activities responds to economies of scale, transportation costs, and agglomeration effects. Under this approach, the territorial distribution of GVA and population is interpreted as an indirect indicator of the intensity of economic agglomeration processes. Consequently, the descriptive analysis conducted makes it possible to assess whether Ecuador's territorial structure reproduces the core–periphery dynamics described in the theoretical literature.
RESULTS
Official data from the Central Bank of Ecuador reveal a strong economic concentration in the distribution of Gross Value Added at the provincial level, as shown in Table 1, with Guayas and Pichincha standing out as the country's main productive hubs based on their average values. This contrasts sharply with provinces such as Carchi, Bolívar, Napo, Morona Santiago, and Galápagos, whose GVA levels do not exceed one billion dollars. Likewise, Guayas exceeded 35 billion dollars, while Morona Santiago and Napo barely surpassed 500 million dollars. This pattern reveals a highly unequal territorial structure, in which most of the value added is generated within a limited geographic area, contrasting with large areas of the country characterized by limited productive structures and little economic diversification.
Guayas and Pichincha, by combining high levels of urbanization and productive diversification, concentrate a significant share of national GVA despite their limited geographic extent. This spatial concentration has been widely documented by Salinas et al. (2021) and is linked to the core–periphery pattern described by Sotomayor (2019), in which the western part of the country acts as the economic core in contrast to an eastern region with less relative weight.
Table 1. Descriptive Statistics of Gross Value Added by Province of Ecuador 2015–2023 (thousands of USD)
|
Province |
Mean |
Maximum |
Minimum |
|
Azuay |
4,750,371.754 |
5,084,289.47 |
4,190,463.68 |
|
Bolívar |
487,013.1545 |
634,677.621 |
407,562.61 |
|
Cañar |
873,335.916 |
1,124,016.35 |
705,026.2 |
|
Carchi |
613,618.6623 |
684,753.524 |
532,325.57 |
|
Cotopaxi |
1,708,468.955 |
1,837,790.66 |
1,561,524.52 |
|
Chimborazo |
1,514,216.232 |
1,974,580.68 |
1,179,658.1 |
|
El Oro |
3,479,820.311 |
4,011,471.72 |
3,173,792.982 |
|
Esmeraldas |
2,302,088.509 |
3,047,274.79 |
1,805,635.07 |
|
Guayas |
29,431,404.01 |
35,912,077.5 |
24,409,212.93 |
|
Imbabura |
1,614,513.267 |
1,877,161.53 |
1,315,621.99 |
|
Loja |
1,674,682.022 |
1,890,552.68 |
1,407,101.77 |
|
Los Ríos |
3,449,577.063 |
3,905,488.85 |
3,140,980.28 |
|
Manabí |
5,397,452.664 |
6,212,364.89 |
4,515,587.27 |
|
Morona Santiago |
464,658.5141 |
523,640.75 |
421,692.46 |
|
Napo |
465,215.1059 |
532,270.61 |
367,730.8949 |
|
Pastaza |
777,506.7826 |
1,115,514.26 |
546,684.6889 |
|
Pichincha |
27,070,601.14 |
30,310,540.2 |
24,411,600.98 |
|
Tungurahua |
2,591,372.427 |
2,857,482.6 |
2,151,575 |
|
Zamora Chinchipe |
691,945.9836 |
1,656,754.64 |
277,482.1632 |
|
Galápagos |
263,707.0378 |
361,892.46 |
206,992.4143 |
|
Sucumbíos |
2,552,948.383 |
3,833,738.33 |
1,508,820.527 |
|
Orellana |
4,727,035.135 |
7,226,708.75 |
2,695,344.804 |
|
Santo Domingo de los Tsáchilas |
1,824,616.489 |
2,003,078.76 |
1,670,041.86 |
|
Santa Elena |
1,243,449.424 |
1,577,586.39 |
958,249.35 |
Source: Own elaboration based on information from the Central Bank of Ecuador.
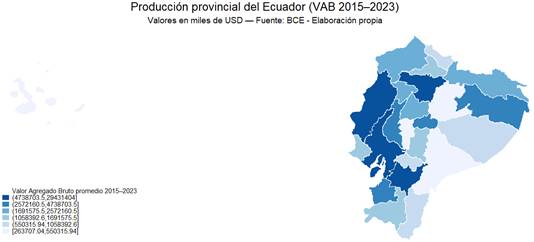
Figure 1 highlights a marked geographic concentration of GVA in Ecuador, as the highest levels of production are represented by greater color intensity concentrated in provinces such as Guayas, Pichincha, Manabí, Azuay, and El Oro. These provinces form a productive corridor encompassing territories in both the Coast and the Highlands, constituting the country's economic axis, with Guayas and Pichincha as the main productive hubs in the Ecuadorian economy.
In contrast, the lighter tones on the map reflect provinces with low levels of GVA, particularly in the Amazon region, such as Morona Santiago, Napo, Zamora Chinchipe, and Pastaza, as well as provinces such as Carchi and Bolívar in the Highlands. These regions constitute the economic periphery, characterized by small-scale productive structures and a high dependence on primary activities. An intermediate case is represented by Orellana and Sucumbíos, where oil activity raises their GVA levels, although this does not imply full integration into the national productive corridor.
Overall, the figure reflects the core–periphery pattern described by Sotomayor (2019), in which most of the value added is generated in a small number of provinces, while large areas of the country face structural limitations in dynamizing their economic activity.
Figure 1. Average Gross Value Added by Province of Ecuador 2015–2023
Source: Own elaboration based on information from the Central Bank of Ecuador.
Provincial population during the 2015–2023 period reveals a strongly heterogeneous territorial structure. In this case, the provinces exhibit highly differentiated demographic levels: while Guayas, Pichincha, and Manabí record the highest population averages (4.45, 3.12, and 1.68 million, respectively), territories such as Galápagos, Napo, and Pastaza remain consistently lagging, with an average population of fewer than 200,000 inhabitants. Furthermore, these patterns are consistent with what was documented by Sotomayor (2019): “41.5% of Ecuador's population was concentrated in just two provinces: Guayas and Pichincha” (p. 54). Consequently, Table 2 presents the results obtained, which, twenty years later, show that this trend persists and has even strengthened, corroborating a long-lasting and highly polarized spatial model.
Similarly, the range between maximum and minimum population levels confirms geographic inequality, as Guayas exceeds 4.6 million inhabitants at its annual maximum during the period, whereas provinces such as Bolívar or Napo do not even reach 250,000 inhabitants. This structural gap reinforces the core–periphery pattern identified in the work of Sotomayor (2019), who explains that economic and demographic development tends to become “anchored” in provinces with extensive infrastructure, urbanization, and productive dynamism.
Table 2. Descriptive Statistics of Population by Province of Ecuador 2015–2023
|
Province |
Mean |
Maximum |
Minimum |
|
Azuay |
810,101 |
828,172 |
774,638 |
|
Bolívar |
208,326 |
210,502 |
204,819 |
|
Carchi |
180,610 |
183,616 |
175,302 |
|
Cañar |
237,287 |
238,020 |
235,419 |
|
Chimborazo |
496,756 |
500,340 |
490,774 |
|
Cotopaxi |
465,713 |
484,792 |
443,863 |
|
El Oro |
721,457 |
744,811 |
683,445 |
|
Esmeraldas |
585,639 |
598,430 |
567,967 |
|
Galápagos |
28,458 |
29,808 |
27,284 |
|
Guayas |
4,459,227 |
4,690,613 |
4,158,440 |
|
Imbabura |
472,493 |
489,961 |
451,794 |
|
Loja |
496,770 |
497,948 |
494,669 |
|
Los Ríos |
923,586 |
959,805 |
867,790 |
|
Manabí |
1,617,601 |
1,684,317 |
1,527,909 |
|
Morona Santiago |
188,911 |
202,851 |
174,078 |
|
Napo |
128,650 |
136,622 |
119,718 |
|
Orellana |
174,987 |
189,568 |
159,355 |
|
Pastaza |
108,056 |
117,062 |
98,370 |
|
Pichincha |
3,127,135 |
3,250,537 |
2,931,254 |
|
Santa Elena |
383,171 |
400,829 |
355,363 |
|
Santo Domingo de los Tsáchilas |
496,880 |
518,576 |
469,484 |
|
Sucumbíos |
204,383 |
207,728 |
196,773 |
|
Tungurahua |
564,105 |
576,407 |
546,729 |
|
Zamora Chinchipe |
110,741 |
116,363 |
104,161 |
Source: Own elaboration based on information from the Central Bank of Ecuador.
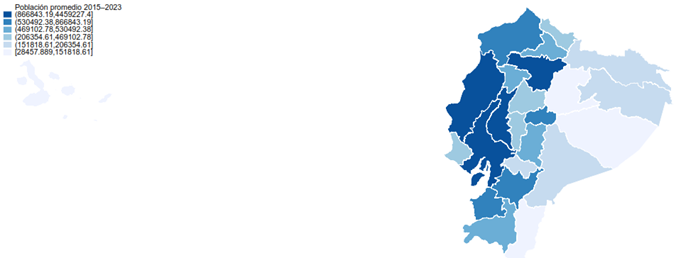
The cartographic image included in Figure 2 facilitates a clearer visualization of the geography of population concentration. Thus, the areas with the greatest intensity are located in Guayas, Pichincha, Manabí, and Los Ríos. These areas constitute what Sotomayor (2019) refers to as a “western demographic and productive corridor,” characterized by considerable urbanization, road connectivity, and the presence of medium- and large-scale economic activities. In contrast, the Amazon region, with provinces such as Napo, Orellana, Pastaza, and Morona Santiago, is shown in considerably lighter tones, revealing very low population densities. All of this reinforces the existence of a core–periphery-type economic geography, in which GVA and population are overwhelmingly concentrated in the country's most strategic areas.
Sotomayor (2019) emphasizes that these provinces account for approximately 47% of the national territory; however, they house less than 5% of the population. This proportion is almost identical to that observed in our 2015–2023 data. This relationship demonstrates an extremely asymmetric national space, in which population is concentrated in limited areas, while vast territorial extensions contain “demographic voids.” Consequently, it is reinforced that Ecuadorian population concentration is not an isolated phenomenon, but rather a constant and structural pattern in which the economy and territory are closely interconnected.
Figure 2. Average Population by Province of Ecuador 2015–2023
Source: Own elaboration based on information from the Central Bank of Ecuador.
The results show that GVA growth between 2015 and 2023 exhibits significant territorial heterogeneity, distinct from that of the 2007–2014 period, with some provinces experiencing extraordinary growth while others have undergone contractions in economic activity. The average GVA growth across the provinces was 31.3%.
Table 3 shows that the provinces of Zamora Chinchipe, Sucumbíos, Orellana, and Pastaza achieved the highest growth rates, reflecting a recent expansion of their productive bases in extractive and primary activities and demonstrating how territories in the Amazonian periphery experienced extraordinary growth in their economic activity. Despite this accelerated growth, the economic structure has not changed; the productive core remains concentrated in Guayas and Pichincha, demonstrating that the core–periphery relationship remains in effect. In this regard, Rodríguez-Pose (2018) warns that economic concentration does not guarantee sustained growth or the diffusion of its benefits to peripheral territories.
Table 3. Provincial Gross Value Added Growth 2015–2023 (Ecuador = 100; thousands of USD)
|
Province |
Provincial GVA 2015 |
Provincial GVA 2023 |
Growth Rate (2015–2023) |
|
Azuay |
4,765,706.102 |
5,003,714.75 |
4.99 |
|
Bolívar |
554,762.7387 |
474,611.8 |
-14.45 |
|
Cañar |
1,025,293.598 |
807,578.93 |
-21.23 |
|
Carchi |
684,753.5242 |
592,439.53 |
-13.48 |
|
Cotopaxi |
1,731,338.836 |
1,693,471.45 |
-2.19 |
|
Chimborazo |
1,859,165.435 |
1,356,963.59 |
-27.01 |
|
El Oro |
3,293,031.754 |
4,011,471.72 |
21.82 |
|
Esmeraldas |
2,518,870.338 |
1,805,635.07 |
-28.32 |
|
Guayas |
24,409,212.93 |
35,912,077.47 |
47.13 |
|
Imbabura |
1,877,161.528 |
1,655,475.21 |
-11.81 |
|
Loja |
1,837,641.115 |
1,890,552.68 |
2.88 |
|
Los Ríos |
3,555,660.972 |
3,905,488.85 |
9.84 |
|
Manabí |
5,599,683.112 |
5,903,547.81 |
5.43 |
|
Morona Santiago |
452,884.4716 |
523,640.75 |
15.62 |
|
Napo |
367,730.8949 |
494,701.48 |
34.53 |
|
Pastaza |
613,011.1764 |
929,851.08 |
51.69 |
|
Pichincha |
25,312,810.09 |
30,310,540.21 |
19.74 |
|
Tungurahua |
2,756,999.914 |
2,752,890.03 |
-0.15 |
|
Zamora Chinchipe |
289,567.3787 |
1,656,754.64 |
472.15 |
|
Galápagos |
206,992.4143 |
282,115.04 |
36.29 |
|
Sucumbíos |
1,810,650.676 |
3,104,639.23 |
71.47 |
|
Orellana |
3,466,040.551 |
5,822,718.82 |
67.99 |
|
Santo Domingo de los Tsáchilas |
1,799,660.432 |
2,003,078.76 |
11.30 |
|
Santa Elena |
1,253,875.019 |
1,217,470.3 |
-2.90 |
Source: Own elaboration based on information from the Central Bank of Ecuador.
The study of provincial population growth reveals the presence of a marked differentiated pattern between the provinces along the central Coast–Highlands axis, in contrast to those belonging to the Amazon region and peripheral areas. As shown in Table 4, provinces such as Guayas, Pichincha, and Manabí present the highest absolute population increases during the 2015–2023 period.
The current figures are compelling, as Guayas exceeds 4.6 million inhabitants in 2023, while Pichincha reaches more than 3.2 million. Furthermore, this growth occurs positively in intermediate areas such as Los Ríos, El Oro, and Santo Domingo, which act as connecting zones between large urban centers and emerging peripheries. This is consistent with the logic of the “unequal diffusion of growth” described by Myrdal (1957), according to which areas located near metropolitan poles attract part of the demographic dynamism through a pull effect.
On the other hand, the Amazon region exhibits low or moderate growth, as provinces such as Pastaza, Orellana, Morona Santiago, and Zamora Chinchipe record limited demographic increases, reinforcing the previously proposed thesis of the “demographic and functional periphery.” These provinces reveal a limited capacity to retain population, associated with low productive diversification as well as lower urban densities.
Table 4. Provincial Population Growth 2015–2023 (Ecuador = 100)
|
Province |
Provincial Population 2015 |
Provincial Population 2023 |
Growth Rate (2015–2023) |
|
Azuay |
774,638 |
828,172 |
6.91 |
|
Bolívar |
210,330 |
204,819 |
-2.62 |
|
Cañar |
235,419 |
237,527 |
0.90 |
|
Carchi |
175,302 |
179,142 |
2.19 |
|
Cotopaxi |
443,863 |
484,792 |
9.22 |
|
Chimborazo |
495,036 |
490,774 |
-0.86 |
|
El Oro |
683,445 |
744,811 |
8.98 |
|
Esmeraldas |
567,967 |
598,430 |
5.36 |
|
Guayas |
4,158,440 |
4,690,613 |
12.80 |
|
Imbabura |
451,794 |
489,961 |
8.45 |
|
Loja |
494,669 |
496,685 |
0.41 |
|
Los Ríos |
867,790 |
959,805 |
10.60 |
|
Manabí |
1,527,909 |
1,684,317 |
10.24 |
|
Morona Santiago |
174,078 |
202,851 |
16.53 |
|
Napo |
119,718 |
136,622 |
14.12 |
|
Pastaza |
98,370 |
117,062 |
19.00 |
|
Pichincha |
2,931,254 |
3,250,537 |
10.89 |
|
Tungurahua |
546,729 |
576,407 |
5.43 |
|
Zamora Chinchipe |
104,161 |
116,363 |
11.71 |
|
Galápagos |
27,284 |
29,808 |
9.25 |
|
Sucumbíos |
196,773 |
206,360 |
4.87 |
|
Orellana |
159,355 |
189,568 |
18.96 |
|
Santo Domingo de los Tsáchilas |
469,484 |
518,576 |
10.46 |
|
Santa Elena |
355,363 |
400,829 |
12.79 |
Source: Own elaboration based on information from the Central Bank of Ecuador.
A highly pronounced structural duality is evident between the distribution of population and land area in Ecuador. Amazonian provinces such as Pastaza, Morona Santiago, Orellana, and Sucumbíos account for significant percentages of the national territory, approximately between 7% and 12%; nevertheless, each has less than 1.2% of the population.
This pattern is consistent with the statement that “the eastern provinces account for 46.8% of the national territory and only 4.7% of the total population” (Sotomayor, 2019, p. 54). The 2015 data replicate this phenomenon exactly; Pastaza, for example, accounts for more than 11.75% of the national land area but only 0.74% of the population.
In contrast, Guayas and Pichincha, with relatively small territorial extensions (6.12% and 3.78%, respectively), together accounted for just over 41.5% of the population in 2015. This reveals a profound spatial pattern, as the population is concentrated within a relatively small area, relegating vast extensions of territory to extremely low population densities.
Table 5. Population–Area Concentration in Ecuador by Province 2015
|
Province |
Population |
Population Index |
Area (km²) |
Area Index |
|
Ecuador |
16,269,171 |
100 |
252,159 |
100 |
|
Azuay |
774,638 |
4.76 |
8,310 |
3.30 |
|
Bolívar |
210,330 |
1.29 |
3,945 |
1.56 |
|
Cañar |
235,419 |
1.45 |
3,146 |
1.25 |
|
Carchi |
175,302 |
1.08 |
3,780 |
1.50 |
|
Cotopaxi |
443,863 |
2.73 |
6,108 |
2.42 |
|
Chimborazo |
495,036 |
3.04 |
6,500 |
2.58 |
|
El Oro |
683,445 |
4.20 |
5,767 |
2.29 |
|
Esmeraldas |
567,967 |
3.49 |
16,132 |
6.40 |
|
Guayas |
4,158,440 |
25.56 |
15,430 |
6.12 |
|
Imbabura |
451,794 |
2.78 |
4,588 |
1.82 |
|
Loja |
494,669 |
3.04 |
11,063 |
4.39 |
|
Los Ríos |
867,790 |
5.33 |
7,205 |
2.86 |
|
Manabí |
1,527,909 |
9.39 |
18,940 |
7.51 |
|
Morona Santiago |
174,078 |
1.07 |
24,059 |
9.54 |
|
Napo |
119,718 |
0.74 |
12,543 |
4.97 |
|
Pastaza |
98,370 |
0.60 |
29,641 |
11.75 |
|
Pichincha |
2,931,254 |
18.02 |
9,536 |
3.78 |
|
Tungurahua |
546,729 |
3.36 |
3,386 |
1.34 |
|
Zamora Chinchipe |
104,161 |
0.64 |
10,584 |
4.20 |
|
Galápagos |
27,284 |
0.17 |
4,583 |
1.82 |
|
Sucumbíos |
196,773 |
1.21 |
18,084 |
7.17 |
|
Orellana |
159,355 |
0.98 |
21,692 |
8.60 |
|
Santo Domingo de los Tsáchilas |
469,484 |
2.89 |
3,447 |
1.37 |
|
Santa Elena |
355,363 |
2.18 |
3,690 |
1.46 |
Source: Own elaboration based on information from the Central Bank of Ecuador.
The results for 2023 not only confirm but also amplify the trend observed in 2015, given that the population concentration in Guayas and Pichincha rises to more than 44%, while their combined territorial share remains below 10% of the national territory. Manabí and Los Ríos provide a clear complement to this agglomeration, adding nearly 15% more.
When the six provinces along the Coast–Highlands axis (Guayas, Pichincha, Manabí, Los Ríos, Azuay, and El Oro) are considered together, 68.17% of the national population is found to be concentrated in only 21–22% of Ecuadorian territory. This figure is, in fact, higher than that reported in 2024 according to Sotomayor (2019), implying that demographic concentration intensified over the last ten years.
Table 6. Population–Area Concentration in Ecuador by Province 2023
|
Province |
Population |
Population Index |
Area (km²) |
Area Index |
|
Ecuador |
17,834,831 |
100 |
252,159 |
100 |
|
Azuay |
828,172 |
4.64 |
8,310 |
3.30 |
|
Bolívar |
204,819 |
1.15 |
3,945 |
1.56 |
|
Cañar |
237,527 |
1.33 |
3,146 |
1.25 |
|
Carchi |
179,142 |
1.00 |
3,780 |
1.50 |
|
Cotopaxi |
484,792 |
2.72 |
6,108 |
2.42 |
|
Chimborazo |
490,774 |
2.75 |
6,500 |
2.58 |
|
El Oro |
744,811 |
4.18 |
5,767 |
2.29 |
|
Esmeraldas |
598,430 |
3.36 |
16,132 |
6.40 |
|
Guayas |
4,690,613 |
26.30 |
15,430 |
6.12 |
|
Imbabura |
489,961 |
2.75 |
4,588 |
1.82 |
|
Loja |
496,685 |
2.78 |
11,063 |
4.39 |
|
Los Ríos |
959,805 |
5.38 |
7,205 |
2.86 |
|
Manabí |
1,684,317 |
9.44 |
18,940 |
7.51 |
|
Morona Santiago |
202,851 |
1.14 |
24,059 |
9.54 |
|
Napo |
136,622 |
0.77 |
12,543 |
4.97 |
|
Pastaza |
117,062 |
0.66 |
29,641 |
11.75 |
|
Pichincha |
3,250,537 |
18.23 |
9,536 |
3.78 |
|
Tungurahua |
576,407 |
3.23 |
3,386 |
1.34 |
|
Zamora Chinchipe |
116,363 |
0.65 |
10,584 |
4.20 |
|
Galápagos |
29,808 |
0.17 |
4,583 |
1.82 |
|
Sucumbíos |
206,360 |
1.16 |
18,084 |
7.17 |
|
Orellana |
189,568 |
1.06 |
21,692 |
8.60 |
|
Santo Domingo de los Tsáchilas |
518,576 |
2.91 |
3,447 |
1.37 |
|
Santa Elena |
400,829 |
2.25 |
3,690 |
1.46 |
Source: Own elaboration based on information from the Central Bank of Ecuador.
The results reveal a structural disconnect between provincial GVA and the spatial distribution of the national territory, evidencing a strong economic concentration in provinces with small areas compared to the GVA they generate. This pattern is consistent with what was indicated by Sotomayor (2019), who demonstrates how national production tends to concentrate in urban nodes with high economic activity, while peripheral provinces maintain a marginal share of national GVA.
As in Sotomayor's (2019) research, it can be determined that in 2015, Guayas and Pichincha, which together account for no more than 10% of the national territory, generated more than 54% of GVA. In contrast, the Amazonian provinces of Zamora Chinchipe, Pastaza, Morona Santiago, Sucumbíos, and Orellana produced 7.21% of GVA while accounting for 41.26% of the country's total land area.
Table 7. GVA–Area Concentration in Ecuador by Province 2015 (thousands of USD)
|
Province |
GVA 2015 |
GVA Index |
Area (km²) |
Area Index |
|
Ecuador |
92,042,505 |
100 |
252,159 |
100 |
|
Azuay |
4,765,706.102 |
5.18 |
8,310 |
3.30 |
|
Bolívar |
554,762.7387 |
0.60 |
3,945 |
1.56 |
|
Cañar |
1,025,293.598 |
1.11 |
3,146 |
1.25 |
|
Carchi |
684,753.5242 |
0.74 |
3,780 |
1.50 |
|
Cotopaxi |
1,731,338.836 |
1.88 |
6,108 |
2.42 |
|
Chimborazo |
1,859,165.435 |
2.02 |
6,500 |
2.58 |
|
El Oro |
3,293,031.754 |
3.58 |
5,767 |
2.29 |
|
Esmeraldas |
2,518,870.338 |
2.74 |
16,132 |
6.40 |
|
Guayas |
24,409,212.93 |
26.52 |
15,430 |
6.12 |
|
Imbabura |
1,877,161.528 |
2.04 |
4,588 |
1.82 |
|
Loja |
1,837,641.115 |
2.00 |
11,063 |
4.39 |
|
Los Ríos |
3,555,660.972 |
3.86 |
7,205 |
2.86 |
|
Manabí |
5,599,683.112 |
6.08 |
18,940 |
7.51 |
|
Morona Santiago |
452,884.4716 |
0.49 |
24,059 |
9.54 |
|
Napo |
367,730.8949 |
0.40 |
12,543 |
4.97 |
|
Pastaza |
613,011.1764 |
0.67 |
29,641 |
11.75 |
|
Pichincha |
25,312,810.09 |
27.50 |
9,536 |
3.78 |
|
Tungurahua |
2,756,999.914 |
3.00 |
3,386 |
1.34 |
|
Zamora Chinchipe |
289,567.3787 |
0.31 |
10,584 |
4.20 |
|
Galápagos |
206,992.4143 |
0.22 |
4,583 |
1.82 |
|
Sucumbíos |
1,810,650.676 |
1.97 |
18,084 |
7.17 |
|
Orellana |
3,466,040.551 |
3.77 |
21,692 |
8.60 |
|
Santo Domingo de los Tsáchilas |
1,799,660.432 |
1.96 |
3,447 |
1.37 |
|
Santa Elena |
1,253,875.019 |
1.36 |
3,690 |
1.46 |
Source: Own elaboration based on information from the Central Bank of Ecuador.
The results demonstrate that the phenomenon described by Sotomayor (2019) is not only repeated in 2015 but also persists in 2023: Guayas and Pichincha concentrate 58.03% of GVA in just 9.9% of the national territory. The trend of the Amazon region having a marginal share in national production remains in effect, despite collectively accounting for a larger share of the country's territorial area.
Table 8. GVA–Area Concentration in Ecuador by Province 2023 (thousands of USD)
|
Province |
GVA 2023 |
GVA Index |
Area (km²) |
Area Index |
|
Ecuador |
114,111,429.2 |
100 |
252,159 |
100 |
|
Azuay |
5,003,714.75 |
4.38 |
8,310 |
3.30 |
|
Bolívar |
474,611.8 |
0.42 |
3,945 |
1.56 |
|
Cañar |
807,578.93 |
0.71 |
3,146 |
1.25 |
|
Carchi |
592,439.53 |
0.52 |
3,780 |
1.50 |
|
Cotopaxi |
1,693,471.45 |
1.48 |
6,108 |
2.42 |
|
Chimborazo |
1,356,963.59 |
1.19 |
6,500 |
2.58 |
|
El Oro |
4,011,471.72 |
3.52 |
5,767 |
2.29 |
|
Esmeraldas |
1,805,635.07 |
1.58 |
16,132 |
6.40 |
|
Guayas |
35,912,077.47 |
31.47 |
15,430 |
6.12 |
|
Imbabura |
1,655,475.21 |
1.45 |
4,588 |
1.82 |
|
Loja |
1,890,552.68 |
1.66 |
11,063 |
4.39 |
|
Los Ríos |
3,905,488.85 |
3.42 |
7,205 |
2.86 |
|
Manabí |
5,903,547.81 |
5.17 |
18,940 |
7.51 |
|
Morona Santiago |
523,640.75 |
0.46 |
24,059 |
9.54 |
|
Napo |
494,701.48 |
0.43 |
12,543 |
4.97 |
|
Pastaza |
929,851.08 |
0.81 |
29,641 |
11.75 |
|
Pichincha |
30,310,540.21 |
26.56 |
9,536 |
3.78 |
|
Tungurahua |
2,752,890.03 |
2.41 |
3,386 |
1.34 |
|
Zamora Chinchipe |
1,656,754.64 |
1.45 |
10,584 |
4.20 |
|
Galápagos |
282,115.04 |
0.25 |
4,583 |
1.82 |
|
Sucumbíos |
3,104,639.23 |
2.72 |
18,084 |
7.17 |
|
Orellana |
5,822,718.82 |
5.10 |
21,692 |
8.60 |
|
Santo Domingo de los Tsáchilas |
2,003,078.76 |
1.76 |
3,447 |
1.37 |
|
Santa Elena |
1,217,470.3 |
1.07 |
3,690 |
1.46 |
Source: Own elaboration based on information from the Central Bank of Ecuador.
The results show that the economic concentration observed in Guayas and Pichincha is consistent with the postulates of New Economic Geography. The presence of economies of scale, logistical infrastructure, and institutional networks generates locational advantages that attract capital and labor, reinforcing agglomeration processes. This phenomenon explains why core territories continue to accumulate productive activity, while peripheral regions maintain more specialized and less dynamic economic structures.
DISCUSSION
The results obtained in this study confirm the persistence of a deeply unequal territorial structure in Ecuador, characterized by a marked economic and demographic concentration around the provinces of Guayas and Pichincha. This configuration reproduces the core–periphery pattern widely documented by New Economic Geography (Krugman, 1991; Brakman et al., 2009), in which regions with initial advantages tend to reinforce them through cumulative processes, consolidating their centrality in relation to peripheral territories.
The fact that more than 58% of national GVA and approximately half of the population are concentrated in only two provinces reveals not only a process of functional agglomeration but also a structural limitation to the harmonious development of the national territory. As Myrdal (1957) and Fujita et al. (1999) have warned, economic concentration is not a neutral phenomenon; it tends to reproduce itself through virtuous cycles in core areas and vicious cycles in the periphery. In the Ecuadorian case, this process has been exacerbated by the weakness of territorial planning policies and the limited productive integration of the most lagging regions.
Although some peripheral provinces, particularly in the Amazon region, record growth rates above the national average in certain years, this dynamism is often fragile and dependent on extractive sectors, without sustainable productive diversification. This confirms the argument put forward by authors such as Rodríguez-Pose (2018), who warns that growth based on natural resources does not guarantee territorial convergence or structural improvements in the long term.
In this regard, the unequal territorial distribution of GVA and population has direct implications for public policy formulation. A more balanced territorial development strategy should prioritize investment in connective infrastructure, the strengthening of regional value networks, the decentralization of strategic public services, and the promotion of local productive systems. Likewise, it is essential to advance toward multilevel governance schemes that articulate national planning with regional and local agendas.
The results obtained confirm the persistence of territorial concentration patterns that have been widely documented in the regional economics literature. The significant share of Guayas and Pichincha in national production reflects economic agglomeration processes similar to those observed in other Latin American economies, where the main metropolitan areas concentrate infrastructure, human capital, and specialized services. From the perspective of New Economic Geography, this territorial configuration can be interpreted as the result of cumulative effects derived from economies of scale and locational advantages. In this context, peripheral regions face greater difficulties in attracting investment and diversifying their productive structure, contributing to the persistence of regional disparities.
The findings presented should be interpreted as a starting point for future studies that incorporate more complex approaches to measuring territorial inequality, such as spatial Gini indices or entropy models, and that analyze the interaction among economic geography, territorial fiscal policies, and interprovincial mobility. This perspective would allow for a more comprehensive understanding of the functioning of Ecuador's economic-territorial system within the context of its recent structural transitions.
CONCLUSIONS
The evidence obtained from the analysis of Gross Value Added and population distribution across the provinces of Ecuador during the 2015–2023 period confirms the persistence of a core–periphery-type territorial pattern. The country's geoeconomic structure continues to be characterized by a high concentration of productive and demographic activity in Guayas and Pichincha, which together generate more than 58% of national value added and account for nearly half of the population. This centrality responds to the historical accumulation of strategic infrastructure, high levels of urbanization, and a more diversified productive structure, factors that reinforce their role as articulating nodes of the Ecuadorian economic system.
In contrast, a large part of the Amazonian provinces and some jurisdictions in the northern and southern Highlands maintain a peripheral position within the country's territorial structure. These territories exhibit lower levels of population density, limited productive diversification, and a reduced share in the generation of value added. Although some of these provincial economies have recorded relatively higher growth rates during the period analyzed, this dynamism is primarily associated with extractive or primary activities, without evidence of a structural transformation capable of modifying their relative position within the national economic hierarchy.
These results demonstrate that recent economic growth has not been territorially balanced, reproducing a highly concentrated spatial structure. In this context, the design of public policies aimed at territorial development takes on particular relevance. It is necessary to promote strategies that foster productive diversification in lagging regions, strengthen logistical connectivity, and encourage more integrated territorial planning. Likewise, future research could deepen the analysis by incorporating formal indicators of spatial inequality, such as regional concentration indices or territorial distribution curves, which would make it possible to assess more precisely the magnitude of the regional disparities existing in the country.
REFERENCES
Brito, L., Sotomayor, G., & Apolo, J. (2019). Análisis y perspectivas del valor agregado bruto en la economía ecuatoriana. X-Pedientes Económicos, 3(5), 17–36. https://portal.amelica.org/ameli/jatsRepo/392/3921924010/3921924010.pdf
Banco Central del Ecuador. (2023). Informe de la evolución de la economía ecuatoriana en 2022 y perspectivas 2023. https://contenido.bce.fin.ec/documentos/Administracion/EvolEconEcu_2022pers2023.pdf
Brakman, S., Garretsen, H., & Van Marrewijk, C. (2009). The new introduction to geographical economics. Cambridge University Press. https://doi.org/10.1017/CBO9780511807229
Cabrera Toledo, L., & Muñoz Lascano, L. (2019). Centro, periferia y semiperiferia como categorías geopolíticas: El caso de Chile y Perú en el siglo XXI. Estado & Comunes, 2(9). https://doi.org/10.37228/estado_comunes.v2.n9.2019.119
Hirschman, A. O. (1958). La estrategia de desarrollo económico. Yale University Press. https://www.jstor.org/stable/23395856?seq=50
Iammarino, S., Rodríguez-Pose, A., & Storper, M. (2019). Regional inequality in Europe: Evidence, theory and policy implications. Journal of Economic Geography, 19(2), 273–298. https://doi.org/10.1093/jeg/lby021
Instituto Nacional de Estadística y Censos – INEC. (2022). Proyecciones y estadísticas demográficas del Ecuador. https://www.ecuadorencifras.gob.ec
Krugman, P. (1991). Increasing returns and economic geography. Journal of Political Economy, 99(3), 483–499. https://doi.org/10.1086/261763
Krugman, P. (1992). A dynamic spatial model. NBER Working Paper No. 4219. National Bureau of Economic Research. https://doi.org/10.3386/w4219
Krugman, P. (1998). Whatʼs new about the new economic geography? Oxford Review of Economic Policy, 14(2), 7–17. https://doi.org/10.1093/oxrep/14.2.7
Lechuga-Montenegro, J., & Vera-Oliva, S. (2024). El modelo centro-periferia desde la economía política de la acumulación. Ensayos de Economía, 34(64), 104–132. https://doi.org/10.15446/ede.v34n64.114754
Myrdal, G. (1957). Economic theory and underdeveloped regions. Duckworth. https://archive.org/details/bwb_P8-BNW-782/page/20/mode/2up
Pereira, S., Apunte, R., & Pulgar, M. E. (2018). Relación entre el desempeño de las PYME y el valor agregado bruto. CienciAmérica, 7(1), 98–108. https://dialnet.unirioja.es/descarga/articulo/6553191.pdf
Querales, E., & Chirinos, J. (2022). Teoría de la dependencia vista desde la categoría centro/periferia. Revista Ciencias de la Educación, 32(60), 763–784. http://servicio.bc.uc.edu.ve/educacion/revista/60/art15.pdf
Rodríguez-Pose, A. (2018). The revenge of the places that don’t matter (and what to do about it). Cambridge Journal of Regions, Economy and Society, 11(1), 189–209. https://doi.org/10.1093/cjres/rsx024
Salinas Campuzano, D. X., Cedeño Alonso, J. I., Vega Jaramillo, F. Y., & Sotomayor Pereira, J. G. (2021). El valor agregado bruto del Ecuador 2007–2017 [The gross value added of Ecuador 2007–2017]. Conference Proceedings UTMACH, 5(1), 9–27. https://doi.org/10.48190/cp.v5n1a2
Sotomayor-Pereira, J. G. (2019). Tres ensayos sobre economía regional: El impacto de la geografía económica en Ecuador. https://ruc.udc.es/entities/publication/4102d354-4135-4f1e-81cc-0848f7b5d0bf
Tangya, S. (2009). Regionalization and economic development in Ecuador: An analysis of territorial disparities. Revista Eure, 35(105), 45–65. https://www.eure.cl/index.php/eure/article/view/364
Torres, M., & Ahumada, J. M. (2022). Las relaciones centro–periferia en el siglo XXI. El Trimestre Económico, 89(353), enero–marzo. https://doi.org/10.20430/ete.v89i353.1432
Vega, F., Brito, L., Apolo, N., & Sotomayor, J. (2020). Influencia de la recaudación fiscal en el valor agregado bruto de los cantones de la provincia de El Oro (Ecuador), para el periodo 2007–2017. ESPACIOS, 41(15), 15–27. https://www.revistaespacios.com/a20v41n15/20411515.html
World Bank. (2020). Cities, crowding, and the coronavirus: Predicting contagion risk hotspots. World Bank Group. https://openknowledge.worldbank.org/handle/10986/33648
World Bank. (2020). World Development Report 2020: Trading for Development in the Age of Global Value Chains. https://doi.org/10.1596/978-1-4648-1457-0
OECD. (2022). OECD regional outlook 2022: Geography of discontent and regional inequalities. OECD Publishing. https://doi.org/10.1787/17017efe-en
CONFLICT OF INTEREST
The authors report no conflicts of interest.