Anny Astrid Espitia-Cubillosa, Robinson Jiménez-Morenob
aIndustrial Engineering Program, New Granada Military University, Bogotá, Colombia.
bMechatronics Engineering Program, New Granada Military University, Bogotá, Colombia.
Corresponding author: anny.espitia@unimilitar.edu.co
Vol. 04, Issue 03 (2025): July-December
ISSN-e 2953-6634
ISSN Print: 3073-1526
Submitted: September 09, 2025
Revised: November 05, 2025
Accepted: December 09, 2025
Espitia-Cubillos, A., & Jiménez-Moreno, R. (2025). Factorial design for selecting an emotion recognition model using artificial intelligence. EASI: Engineering and Applied Sciences in Industry, 4(3), 16-27. https://doi.org/10.53591/easi.V3i2.2617
This article studies the effect of certain supervised training hyperparameters (number of epochs, batch size, and learning rate) on the performance of an artificial intelligence model for recognizing five emotions from facial images. A full factorial design was used, with 60 combinations run 12 times, resulting in 720 experiments developed on Google's Teachable Machine platform. The dependent variable corresponds to the percentage of accuracy in identifying emotions. The data were analyzed using a four-way analysis of variance and post hoc tests. The results show that varying the learning rate from 0.0001 to 0.001 increases accuracy by 46%, using a larger number of batches improves accuracy by 41%, and changing the batch size has the least improvement effect and increases variability. In terms of emotions, neutral was the best identified and sadness the worst. Statistical analysis confirmed significant differences between factor levels and their interactions. It is concluded that properly selecting supervised training hyperparameters is critical to improving the performance of the artificial intelligence model.
Keywords: Supervised Learning, Artificial Intelligence, Analysis of Variance, Factorial Design.
Developments in facial recognition using pattern learning architectures are currently focused on deep learning algorithms (Harrath et al., 2025), which include deep neural network (DNN) architectures (Dong et al., 2025), convolutional architectures (Honcharenko., 2025), and generative adversarial networks (Ritharson et al., 2023). Their applications range from recognizing people of different ages (Septiani, Wahyono & Adhinata, 2025), robotic interaction (Baek, Song & Kong, 2025), authentication systems (Balakrishnan et al., 2025), and video surveillance systems (Li et al., 2023). Similarly, emotion recognition is performed based on pattern identification by supervised learning networks (Li et al., 2025; Igor, Toganas & Shamoi, 2025). Other applications of interest based on facial recognition include emotion recognition for interaction with robots (Mamodiya et al., 2025) and emotion recognition and perception by gender (Aliyev et al., 2025). Machine vision systems allow for the discrimination of emotions (Meng et al., 2024) (Li et al., 2024), as do voice recognition systems (Dutta & Ganapathy, 2024; Yadav et al., 2024), and have been strengthened to operate with patterns under noise or distortion (Jinsha & Bai, 2025). Therefore, the proper management of the learning parameters of artificial intelligence models, such as the learning rate, the batch size used, and the number of training epochs, are common to the deep learning algorithms referenced in emotion detection under facial expression analysis, but they are not clearly identifiable for replication in new applications. This article presents the factorial characterization of the result in emotion recognition by varying the training parameters which allows developers new to artificial intelligence algorithms to be guided on how they affect a particular training (Espitia-Cubillos & Jiménez-Moreno, 2025). Under variations in the learning rate, the batch size used, and the number of training epochs, which allows developers new to artificial intelligence algorithms to be guided on how they affect a particular training.
A general factorial design with four factors and different levels for each factor is used to analyze the results of the experiment. The experiment collects information from each of the possible combinations. This approach provides a complete overview of the effects of each factor and their interactions. The factors are interpreted as the independent or categorical variables being studied. Factor 1 corresponds to the number of epochs for each model (which can be 25, 50, or 100). The second factor corresponds to the size of each batch, which varies between 16 and 32. The third factor is the learning rate, which can be 0.001 or 0.001. The last factor corresponds to the emotions to be identified: 1- neutral, 2- happiness, 3- sadness, 4- anger, or 5- amazement. This information is summarized in Table 1.
Table 1. Factors and levels
| Factor |
Variable |
Level |
Description |
N |
|---|---|---|---|---|
| 1 |
Number of epochs |
1 |
25 |
240 |
| 2 |
50 |
240 |
||
| 3 |
100 |
240 |
||
| 2 |
Batch size |
1 |
16 |
360 |
| 2 |
32 |
360 |
||
| 3 |
Learning rate |
1 |
0,001 |
360 |
| 2 |
0,0001 |
360 |
||
| 4 |
Emotion |
1 |
Neutral |
144 |
| 2 |
Happiness |
144 |
||
| 3 |
Sadness |
144 |
||
| 4 |
Anger |
144 |
||
| 5 |
Amazement |
144 |
The total number of combinations corresponds to the multiplication of the number of levels of each factor, 60 in each run. The experiment is run 12 times for each of the combinations, obtaining 720 data points. For this purpose, the website https://teachablemachine.withgoogle.com/ was used, which allows the creation of supervised learning models, in this case for the recognition of 5 emotions through facial expressions, varying the values of the factors: Number of epochs, Batch size, and Learning rate. The dependent variable selected is the percentage of accuracy of each learning model in identifying each of the emotions studied, measured on a scale from 0 to 100. The results were tabulated, descriptive statistics were calculated, and they were analyzed using a four-way Analysis of Variance (ANOVA) with a complete design using SPSS software with a significance level of 0.05, which allows conclusions to be drawn in this regard.
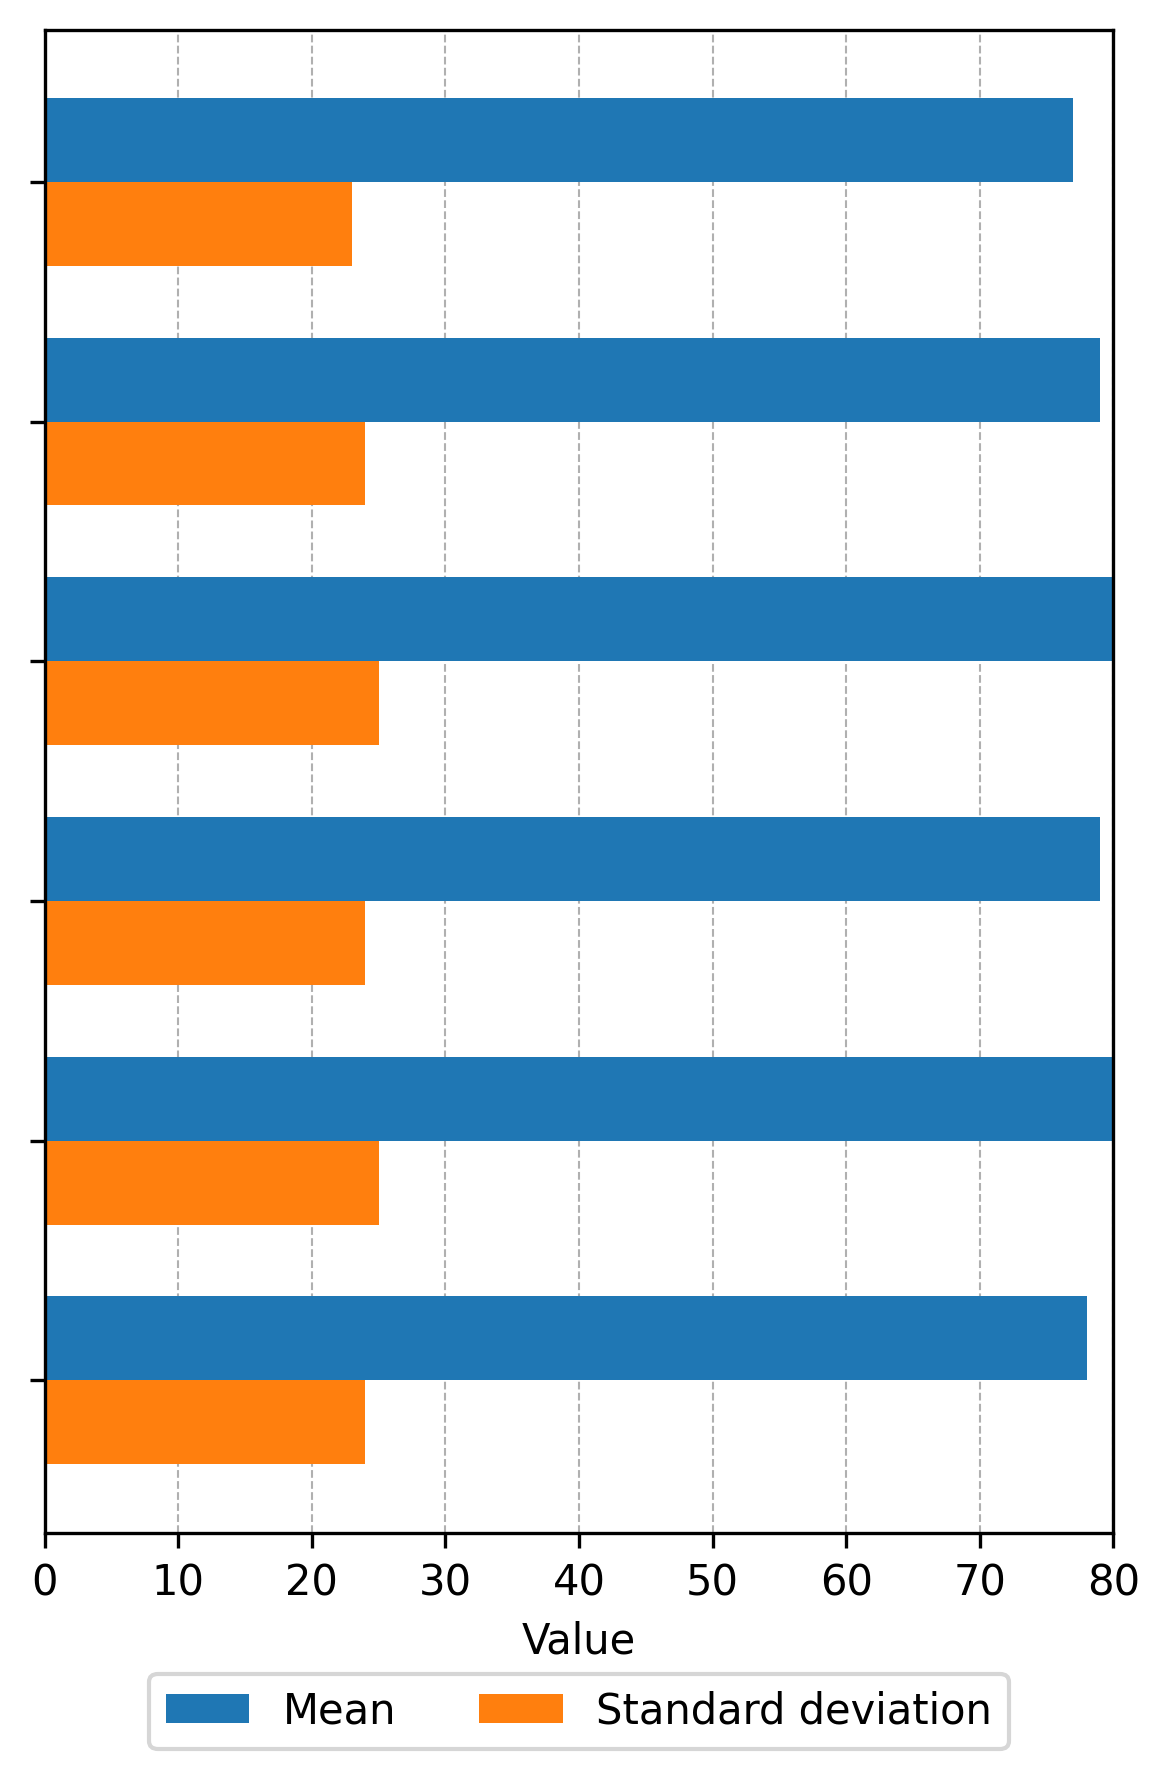
The descriptive statistics (mean and standard deviation) for each of the possible combinations of the different levels of the variables are presented in Figure 1, based on the different levels of the variables: Periods, Batch, Emotion, and Learning Rate, in that order.
On the other hand, descriptive statistics were calculated for each of the factors, which are presented in Figure 2, showing the average accuracy and accuracy deviation for each of the four factors and their respective levels. This allows us to understand how each factor influences the model's performance.
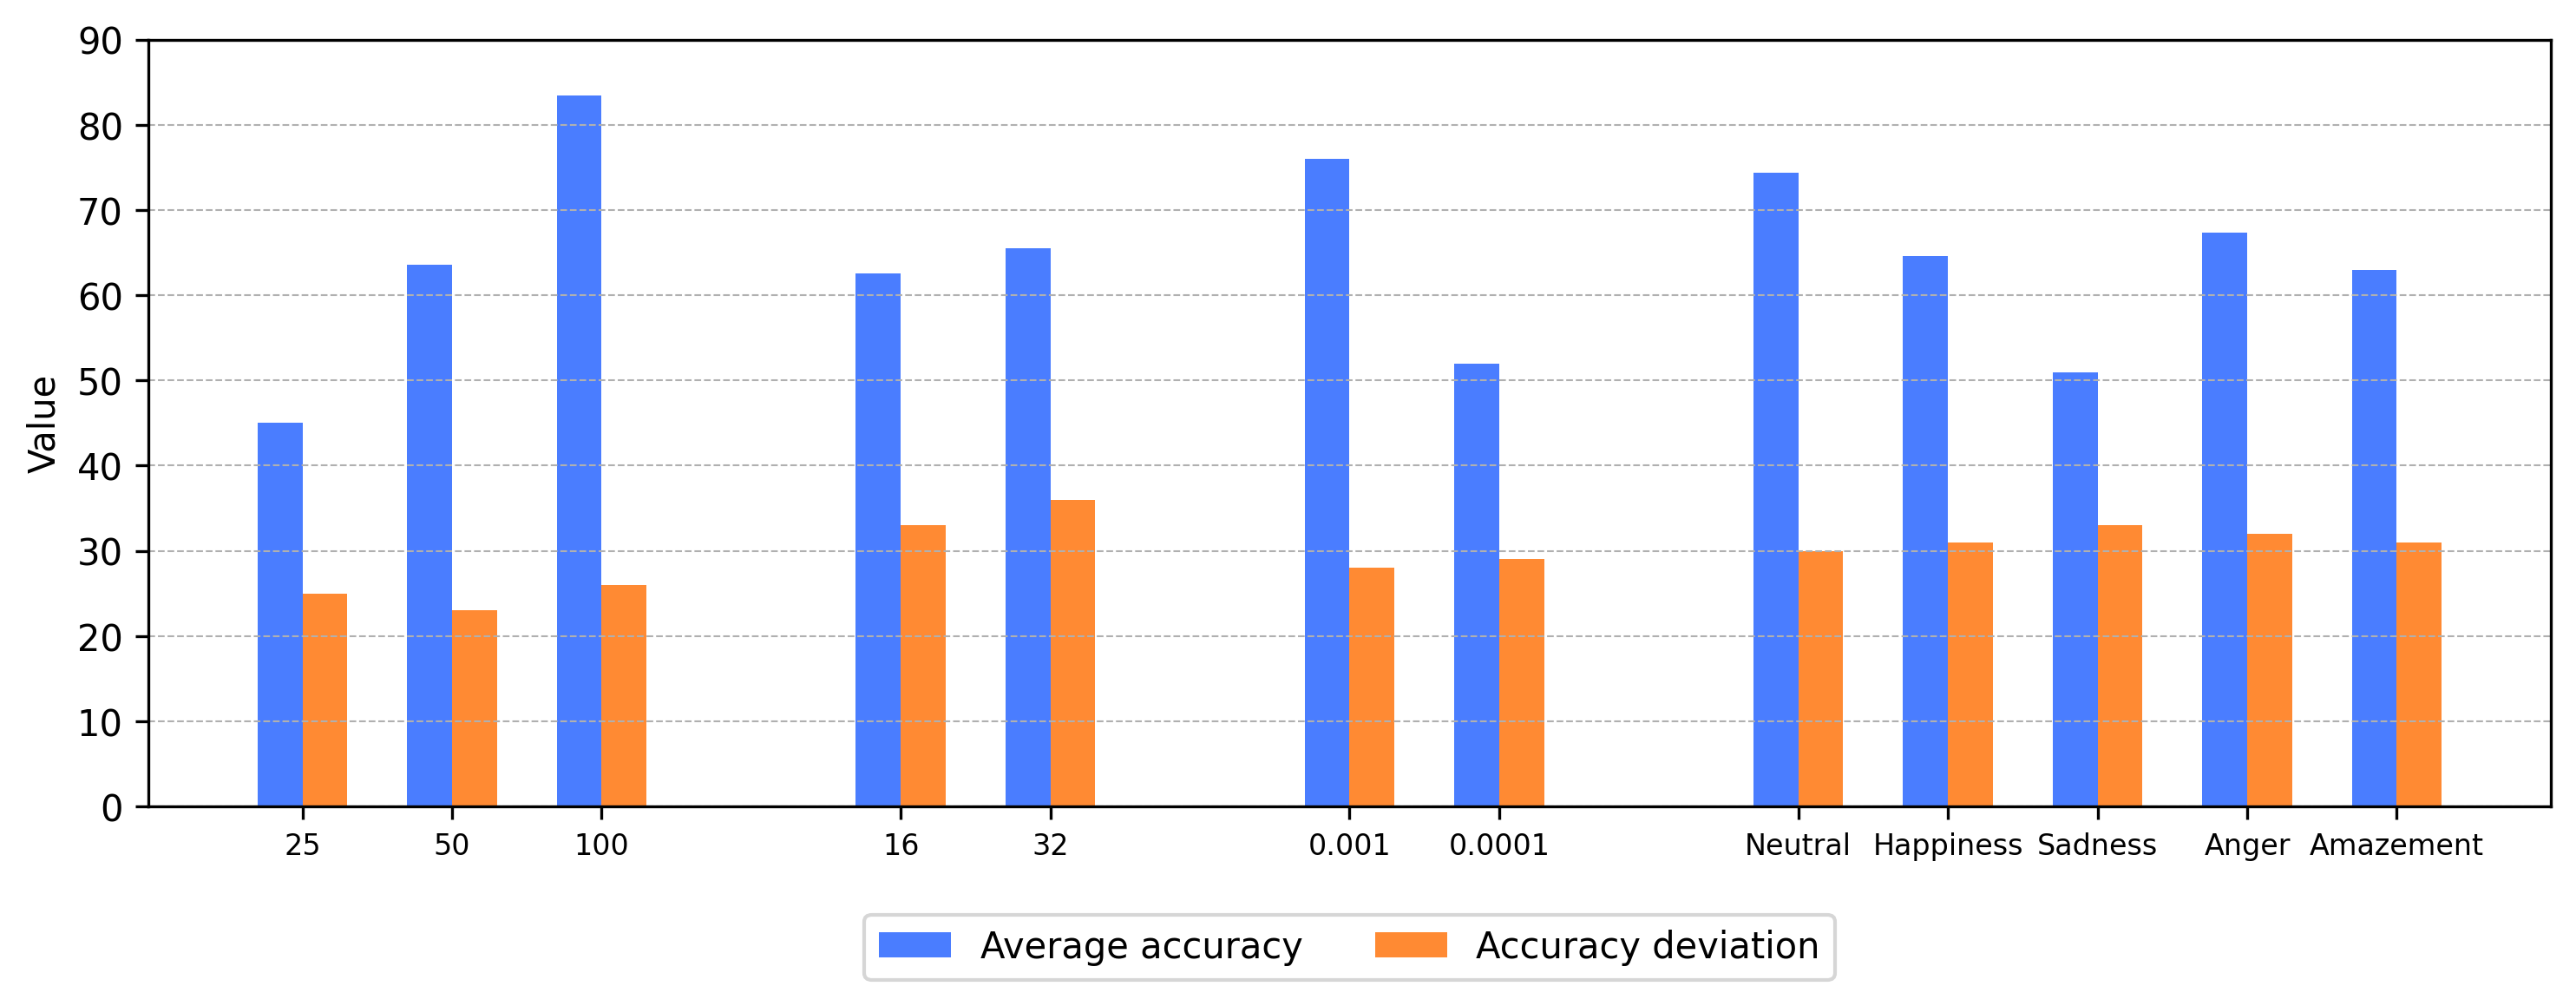
In relation to training hyperparameters, changing the learning rate from 0.0001 to 0.001 improves average accuracy by 46.29% and results show less dispersion. Changing the learning rate dramatically increases average accuracy, indicating that a lower rate is less effective for this model, with accuracy deviation remaining similar at both levels. Regarding the number of epochs, going from 25 to 100 improves accuracy by 40.98% with a slight improvement in deviation, which is slightly lower. As the number of epochs increases, the average accuracy also increases significantly, while the accuracy deviation remains relatively stable, suggesting that a greater number of epochs improves the accuracy of the model without increasing its variability. Finally, increasing the batch size from 16 to 32 slightly improves the average accuracy (4.6625%) but slightly increases the dispersion of the data. As the batch size changes, both the average accuracy and the accuracy deviation vary, although less dramatically than with the learning rate and the number of epochs. In relation to the output variable (emotion recognition), it can be observed that the emotion with the highest degree of accuracy in its identification is neutral, followed by anger, happiness, and surprise, and the least accurate is sadness. The accuracy deviation is relatively high for all emotions, suggesting high variability in the results. We now proceed with the univariate analysis of variance, studying the factors according to the amount of data (N) related in Table 1. The analysis of variance is presented in Table 2, which also highlights that a very high R2 (0.945) was obtained with an equally high adjusted R2 (0.94), indicating that the statistical relationship is quite reliable in explaining 94% of the variability in accuracy based on the four factors studied, and allows valid inferences to be made. Given that the significance level is < 0.001, the null hypothesis is rejected, which means that there are significant differences between the means of all factors and their interactions.
Table 2. Inter-subject effect tests
| Source |
Type III Sum of Squares |
df |
Mean Square |
F |
Sig. |
|---|---|---|---|---|---|
| Corrected Model |
546,036.028 |
59 |
9,254.848 |
191.529 |
< .001 |
| Intercept |
2,950,400.139 |
1 |
2,950,400.139 |
61,058.393 |
< .001 |
| Epochs |
176,916.603 |
2 |
88,458.301 |
1,830.640 |
< .001 |
| Batch Size |
1,531.250 |
1 |
1,531.250 |
31.689 |
< .001 |
| Emotion |
41,723.514 |
4 |
10,430.878 |
215.867 |
< .001 |
| Learning Rate |
104,208.672 |
1 |
104,208.672 |
2,156.594 |
< .001 |
| Epochs × Batch Size |
29,764.008 |
2 |
14,882.004 |
307.982 |
< .001 |
| Epochs × Emotion |
42,893.161 |
8 |
5,361.645 |
110.959 |
< .001 |
| Epochs × Learning Rate |
6,911.536 |
2 |
3,455.768 |
71.517 |
< .001 |
| Batch Size × Emotion |
11,655.069 |
4 |
2,913.767 |
60.300 |
< .001 |
| Batch Size × Learning Rate |
6,020.450 |
1 |
6,020.450 |
124.593 |
< .001 |
| Emotion × Learning Rate |
18,279.175 |
4 |
4,569.794 |
94.572 |
< .001 |
| Epochs × Batch Size × Emotion |
40,273.922 |
8 |
5,034.240 |
104.183 |
< .001 |
| Epochs × Batch Size × Learning Rate |
2,148.108 |
2 |
1,074.054 |
22.228 |
< .001 |
| Epochs × Emotion × Learning Rate |
19,165.117 |
8 |
2,395.640 |
49.578 |
< .001 |
| Batch Size × Emotion × Learning Rate |
2,728.675 |
4 |
682.169 |
14.117 |
< .001 |
| Epochs × Batch Size × Emotion × Learning Rate |
41,816.767 |
8 |
5,227.096 |
108.175 |
< .001 |
| Error |
31,891.833 |
660 |
48.321 |
— |
— |
| Total |
3,528,328.000 |
720 |
— |
— |
— |
| Corrected Total |
577,927.861 |
719 |
— |
— |
— |
Source: authors using SPSS
For the factors seasons and emotion, which have more than two levels, post hoc tests were performed, where the mean square error used was 48.321. A multiple comparison analysis was applied using Tukey's HSD method, based on the factor seasons with three levels. Given the results presented in Table 3, it was determined that there are statistically significant differences in accuracy in all pairwise comparisons of the different levels of the periods factor. Period 3 has the highest accuracy, followed by period 2, and period 1 has the lowest accuracy. Since all differences are significant and the confidence intervals do not include 0, performance in emotion identification (in terms of accuracy) improves consistently across epochs, suggesting a systematic effect of the “epoch” variable on accuracy, with a trend of progressive improvement.
Table 3. Tukey's HSD test for the factor “epochs”
| (I) Epochs |
(J) Epochs |
Mean Difference (I − J) |
Std. Error |
Sig. |
95% Confidence interval |
Lower Bound |
|---|---|---|---|---|---|---|
| 1.00 |
2.00 |
−18.4667* |
0.63457 |
< .001 |
−19.9573 |
1.00 |
| 3.00 |
−38.3875* |
0.63457 |
< .001 |
−39.8781 |
|
|
| 2.00 |
1.00 |
18.4667* |
0.63457 |
< .001 |
16.9761 |
2.00 |
| 3.00 |
−19.9208* |
0.63457 |
< .001 |
−21.4114 |
|
|
| 3.00 |
1.00 |
38.3875* |
0.63457 |
< .001 |
36.8969 |
3.00 |
| 2.00 |
19.9208* |
0.63457 |
< .001 |
18.4302 |
|
Source: authors using SPSS
The same multiple comparison analysis was applied to identify significant differences in identification accuracy between different emotions. In this case, Table 4 shows statistically significant differences (p < 0.05) in most pairwise comparisons. Sadness had the lowest average accuracy, showing significant negative differences compared to all other emotions (p < 0.001). In contrast, the neutral emotion consistently showed superior accuracy compared to the other emotions, with mean differences ranging from 7.04 to 23.40 points. However, there was no significant difference in accuracy between the emotions of happiness and amazement.
Table 4. Tukey's HSD test for the factor “periods”
| (I) Emotion |
(J) Emotion |
Mean Difference (I − J) |
Std. Error |
Sig. |
95% Conf. Interv. |
Lowe Bound |
|---|---|---|---|---|---|---|
| 1.00 |
2.00 |
9.7708* |
0.81922 |
< .001 |
7.5300 |
1.00 |
| 3.00 |
23.3958* |
0.81922 |
< .001 |
21.1550 |
|
|
| 4.00 |
7.0417* |
0.81922 |
< .001 |
4.8008 |
|
|
| 5.00 |
11.4236* |
0.81922 |
< .001 |
9.1828 |
|
|
| 2.00 |
1.00 |
−9.7708* |
0.81922 |
< .001 |
−12.0117 |
2.00 |
| 3.00 |
13.6250* |
0.81922 |
< .001 |
11.3842 |
|
|
| 4.00 |
−2.7292* |
0.81922 |
.008 |
−4.9700 |
|
|
| 5.00 |
1.6528 |
0.81922 |
.259 |
−0.5881 |
|
|
| 3.00 |
1.00 |
−23.3958* |
0.81922 |
< .001 |
−25.6367 |
3.00 |
| 2.00 |
−13.6250* |
0.81922 |
< .001 |
−15.8658 |
|
|
| 4.00 |
−16.3542* |
0.81922 |
< .001 |
−18.5950 |
|
|
| 5.00 |
−11.9722* |
0.81922 |
< .001 |
−14.2131 |
|
|
| 4.00 |
1.00 |
−7.0417* |
0.81922 |
< .001 |
−9.2825 |
4.00 |
| 2.00 |
2.7292* |
0.81922 |
.008 |
0.4883 |
|
|
| 3.00 |
16.3542* |
0.81922 |
< .001 |
14.1133 |
|
|
| 5.00 |
4.3819* |
0.81922 |
< .001 |
2.1411 |
|
|
| 5.00 |
1.00 |
−11.4236* |
0.81922 |
< .001 |
−13.6645 |
5.00 |
| 2.00 |
−1.6528 |
0.81922 |
.259 |
−3.8936 |
|
|
| 3.00 |
11.9722* |
0.81922 |
< .001 |
9.7314 |
|
|
| 4.00 |
−4.3819* |
0.81922 |
< .001 |
−6.6228 |
|
Source: authors using SPSS
Levene's test of equality (Table 5) was applied, indicating the absence of homogeneity of variances.
Table 5. Levene's test of equality of error variances (a,b)
| Variable | Test Based On | Levene Statistic | df1 | ||||
|---|---|---|---|---|---|---|---|
| Accuracy |
Mean |
8.236 |
59 |
660 |
|||
| |
Median |
5.171 |
59 |
660 |
|||
| |
Median and with adjusted df |
5.171 |
59 |
57.061 |
|||
| |
Trimmed mean |
6.841 |
59 |
660 |
|||
Tests the null hypothesis that the error variance of the dependent variable is equal across groups. a. Dependent variable: Accuracy b. Design: Intercept + Epochs + Batch Size + Emotion + Learning Rate + Epochs × Batch Size + Epochs × Emotion + Epochs × Learning Rate + Batch Size × Emotion + Batch Size × Learning Rate + Emotion × Learning Rate + Epochs × Batch Size × Emotion + Epochs × Batch Size × Learning Rate + Epochs × Emotion × Learning Rate + Batch Size × Emotion × Learning Rate + Epochs × Batch Size × Emotion × Learning Rate
Given the complexity of the factorial design, which includes several main variables and multiple interactions, often introducing collinearity and possible specification problems, it was determined that it was necessary to check for the presence or absence of heteroscedasticity in the residuals of the regression model predicting the dependent variable Accuracy. To this end, White's test was performed (Table 6), considering that heteroscedasticity can compromise the validity of statistical inferences derived from the model, especially those related to standard errors, p-values, and significance tests. The statistically significant result of the test (χ² = 102.511, df = 59, p < 0.001) indicates the presence of heteroscedasticity in the model residuals, This means that, although the estimated coefficients of the regression model are unbiased, the efficiency of these estimators is affected, so their use is not recommended for predictive purposes, but rather for decision-making in selecting the most favorable scenario for the AI model that recognizes various emotions.
Table 6. White’s Test for Heteroscedasticity (a,b,c)
| Chi-square |
df |
Sig. |
|---|---|---|
| 102.511 |
59 |
< .001 |
a. Dependent variable: Accuracy b. Tests the null hypothesis that the variance of the errors does not depend on the values of the independent variables. c. Design: Intercept + Epochs + Batch Size + Emotion + Learning Rate + Epochs × Batch Size + Epochs × Emotion + Epochs × Learning Rate + Batch Size × Emotion + Batch Size × Learning Rate + Emotion × Learning Rate + Epochs × Batch Size × Emotion + Epochs × Batch Size × Learning Rate + Epochs × Emotion × Learning Rate + Batch Size × Emotion × Learning Rate + Epochs × Batch Size × Emotion × Learning Rate Source: authors using SPSS
The profile graphs in Figure 3 show the variations in the estimated average marginal rates of accuracy with respect to the two learning rate levels (1-0.001 and 2-0.0001). From Figure 3a, for most emotions, it is more convenient to have a higher learning rate, except for anger. Figure 3b shows better results at higher learning rates regardless of the number of epochs selected. In this case, the results confirm that it is preferable to have a greater number of epochs in the AI model. Figure 3c shows that the best scenario occurs when the learning rate is higher.
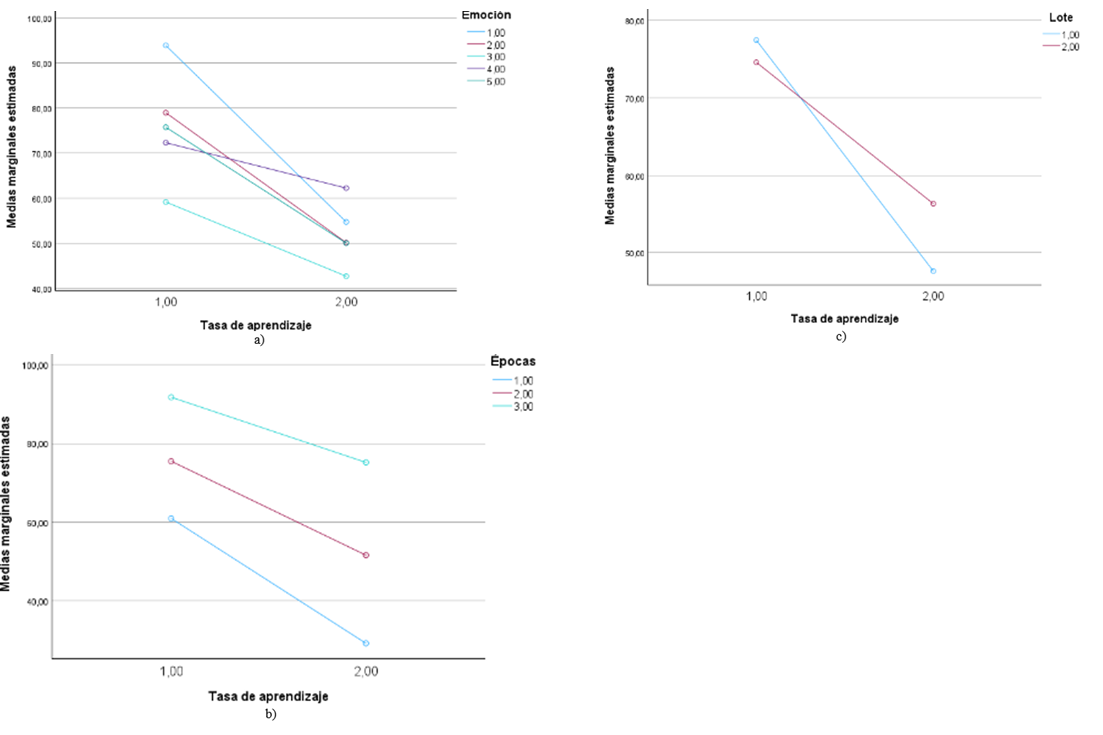
Figure 4 shows that it is advisable to have a greater number of epochs, regardless of the batch size, learning rate and emotion to be identified.
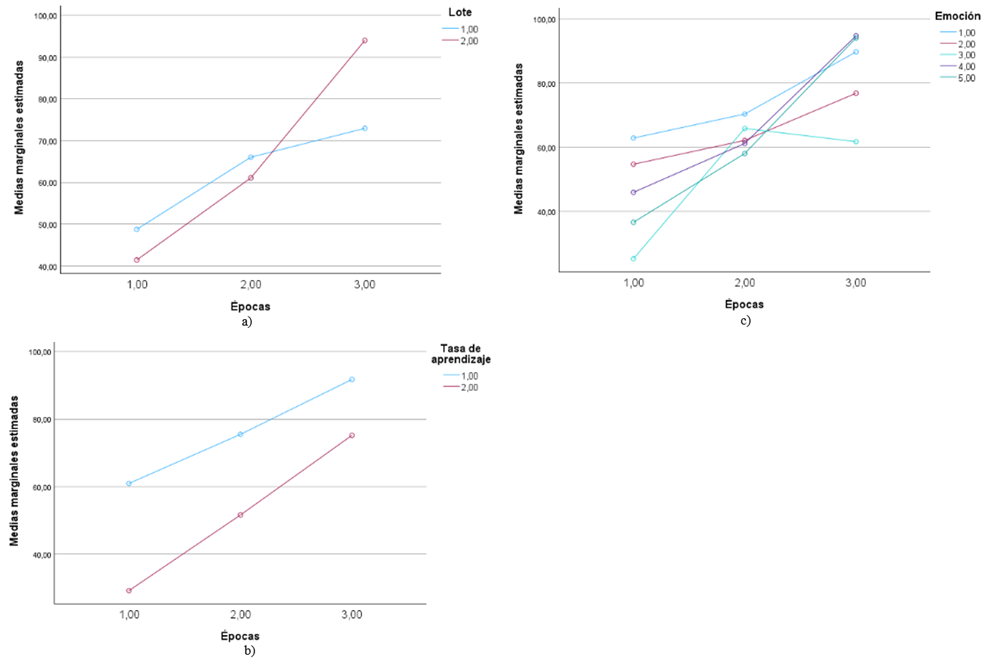
Figure 5 shows that a higher number of batches translates into better marginal mean accuracy in emotion identification (except anger), regardless of the number of epochs and learning rate.
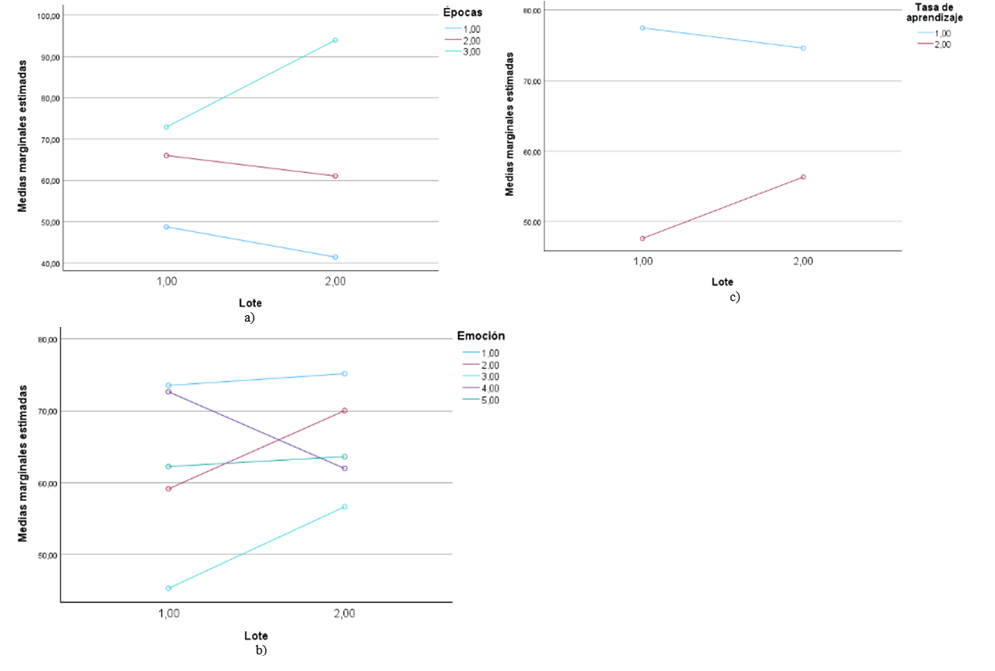
Figure 6 shows that, in general, the best results in emotion recognition accuracy are obtained in the scenarios with the highest number of epochs, batch size, and learning rate.
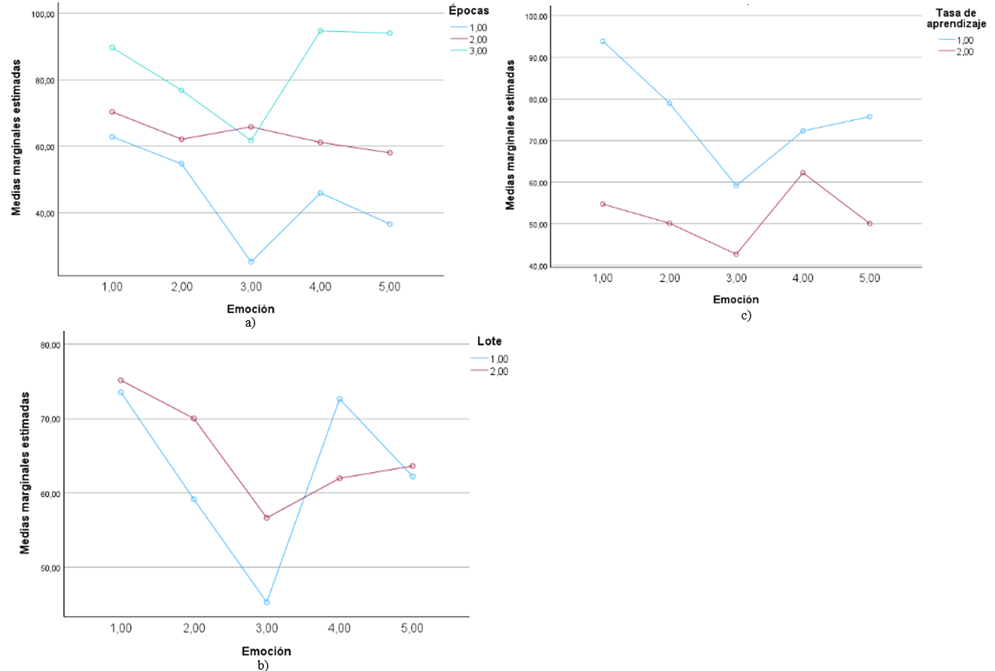
Regarding the hyperparameters used for AI training, it is concluded that the learning rate is the most influential parameter in the accuracy of the facial emotion recognition model. Increasing the learning rate makes a significant difference in average accuracy, making it much more effective for this model, without significantly affecting the bias. Increasing the number of epochs improves average accuracy significantly; the bias remains almost constant, indicating that the model is becoming more accurate without increasing the results. Increasing the batch size slightly increases average accuracy, although the bias also increases slightly. This type of emotion has a significant effect on accuracy, with sadness associated with considerably lower performance, and neutral associated with the highest performance. Regarding the model's performance in identifying each emotion, the highest average accuracy is for Neutral (around 74.3%) and the lowest for Sadness (50.9%). The accuracy deviation is similar in all cases, suggesting that the model has the same variability in its predictions, but is more often correct with certain emotions. Therefore, there is a future need to design specific approaches for emotions with lower recognition rates. The factorial design and applied statistical analysis clearly identify the individual and combined influence of the hyperparameter values used in the training processes, providing a solid basis for decision-making when selecting supervised learning models for emotion recognition. Overall, the proposed factorial characterization is a useful tool to guide novice developers in the proper configuration of artificial intelligence models.
Product derived from the research project entitled “Diseño de un modelo de interacción humano robot mediante algoritmos de aprendizaje profundo”, code INV-ING-3971, financed by the Vice-Rectory of Research of the Universidad Militar Nueva Granada, 2024.
The authors declared no potential conflicts of interest within this research, authorship, and/or publication of this article.
Aliyev, I., Muradova, G., Aliyeva, S., Mustafazada, S., Smambayev, Z., & Shamoi, P. (2025). Public perception of feminism using sentiment and emotion analysis. IEEE 5th International Conference on Smart Information Systems and Technologies (SIST), 1–8. Astana, Kazakhstan. https://doi.org/10.1109/SIST61657.2025.11139321
Baek, C., Song, J. W., & Kong, K. (2025). Low-light face recognition for mobile robots. 2025 International Technical Conference on Circuits/Systems, Computers, and Communications (ITC-CSCC), 1–5. Seoul, Republic of Korea. https://doi.org/10.1109/ITC-CSCC66376.2025.11137701
Balakrishnan, S. G., Tamizh Selvan, S., Venkatesh, R., Vignesh, G. V., & Vishwa, P. (2025). Enhanced two step authentication system for ATM using multimodal facial recognition. 6th International Conference on Data Intelligence and Cognitive Informatics (ICDICI), 1–8. Tirunelveli, India. https://doi.org/10.1109/ICDICI66477.2025.11134970
Dong, X., Zhao, B., Mojaver, K. R., Liboiron-Ladouceur, O., & Meyer, B. H. (2025). Low-power face recognition using joint optical and electronic deep neural networks. IEEE Embedded Systems Letters. https://doi.org/10.1109/LES.2025.3604285
Dutta, S., & Ganapathy, S. (2024). Leveraging content and acoustic representations for speech emotion recognition. IEEE Transactions on Audio, Speech and Language Processing, 1–11. https://doi.org/10.1109/TASLPRO.2025.3603853
Harrath, Y., Bhutta, M., Adohinzin, O., & KC, N. (2025). Optimized face recognition using reinforcement learning and deep learning feature extraction. 11th International Conference on Big Data Computing Service and Machine Learning Applications (BigDataService), 218–225. Tucson, AZ, United States. https://doi.org/10.1109/BigDataService65758.2025.00040
Honcharenko, T., Dolhopolov, S., Sachenko, I., Achkasov, I., Fesan, A., & Paliy, S. (2025). Automated face recognition system using convolutional neural network. IEEE 5th International Conference on Smart Information Systems and Technologies (SIST), 1–4. Astana, Kazakhstan. https://doi.org/10.1109/SIST61657.2025.11139261
Igor, E., Toganas, N., & Shamoi, P. (2025). Emotion classification in digital art using color features and machine learning. IEEE 5th International Conference on Smart Information Systems and Technologies (SIST), 1–6. Astana, Kazakhstan. https://doi.org/10.1109/SIST61657.2025.11139293
Jinsha, K. S., & Bai, V. R. (2025). Emotion detection from distorted images using optimized CNN & GAN. 4th International Conference on Advances in Computing, Communication, Embedded and Secure Systems (ACCESS), 908–914. Ernakulam, India. https://doi.org/10.1109/ACCESS65134.2025.11135594
Li, H., Xu, Y., Yao, J., Wang, N., Gao, X., & Han, B. (2025). Knowledge-enhanced facial expression recognition with emotional-to-neutral transformation. IEEE Transactions on Multimedia, 1–20. https://doi.org/10.1109/TMM.2025.360491
Li, N., Shen, X., Sun, L., Xiao, Z., Ding, T., Li, T., & Li, X. (2023). Chinese face dataset for face recognition in an uncontrolled classroom environment. IEEE Access, 11, 86963–86976. https://doi.org/10.1109/ACCESS.2023.3302919
Meng, S., Liu, P., Mei, X., & Jiang, J. (2024). Facial negative emotion recognition of special employees based on machine vision. 8th International Workshop on Control Engineering and Advanced Algorithms (IWCEAA), 135–138. Nanjing, China. https://doi.org/10.1109/IWCEAA63616.2024.10823939
Otarbay, Z., Kyzyrkanov, A., Tursynova, N., Turginbekov, A., Saltanat, A., & Amirov, A. (2025). Improving Electroencephalography-Based Emotion Recognition via Transformer Networks for Subject-Independent Classification. IEEE 5th International Conference on Smart Information Systems and Technologies (SIST), 1–6. Astana, Kazakhstan. https://doi.org/10.1109/SIST61657.2025.11139359
Ritharson, P. I., Vidhya, K., Madhavan, G., Barath, D., & Sathish Kumar, K. (2023). GAN-based facial feature reconstruction for improved masked face recognition during COVID. 2023 International Conference on Circuit Power and Computing Technologies (ICCPCT), 1–5. Kollam, India. https://doi.org/10.1109/ICCPCT58313.2023.10245882
Septiani, D., Wahyono, & Adhinata, F. D. (2025). Face recognition underage progression using hybrid features of textures and geometric. 2025 International Workshop on Intelligent Systems (IWIS), 1–6. Ulsan, Republic of Korea. https://doi.org/10.1109/IWIS66215.2025.11142411
Yadav, U., Bondre, S., Thakre, B., & Likhar, K. (2024). Speech-to-text emotion detection system using SVM, CNN, and BERT. 2024 IEEE International Conference on Smart Power Control and Renewable Energy (ICSPCRE), 1–5. Rourkela, India. https://doi.org/10.1109/ICSPCRE62303.2024.10675267