Milton Napoleón Flores Zhamunguia, Eduardo Francisco Baidal Bustamantea, Richard Stev Varas Floresb
aFaculty of Industrial Engineering, Universidad de Guayaquil, Guayaquil, Ecuador, 090112.
bEscuela Superior Politécnica del Litoral, Guayaquil, Ecuador, 090112.
Corresponding author: milton.floresz@ug.edu.ec
Vol. 04, Issue 01 (2025): July
ISSN-e 2953-6634
ISSN Print: 3073-1526
Submitted: February 12, 2025
Revised: May 05, 2025
Accepted: July 05, 2025
Flores Zhamungui, M., et al (2025). Drag and Lift Forces in Blunt and Aerodynamic Bodies. EASI: Engineering and Applied Sciences in Industry, 4(1), 31-41 https://doi.org/10.53591/easi.v4i1.1961
Articles in journal repositories are freely open in digital form. Authors can reproduce and distribute the work on any non-commercial site and grant the journal the right of first publication with the work simultaneously licensed under a CC BY-NC-ND 4.0.
The objective of this study is to analyze the drag and lift forces acting on blunt and streamlined bodies. To achieve this, experiments were conducted in a subsonic wind tunnel using objects of varying geometries, including a small smooth sphere, a large smooth sphere, a rough sphere, a flat disk, and a streamlined body — specifically, a NACA airfoil profile. Airflow within the tunnel was generated using a variable-speed fan, operated at different rotation speeds. Data collection was performed with the aid of specialized software, recording fifty measurements for each case, including drag force, kinematic viscosity, temperature, and airflow velocity. The results were used to construct plots of the drag coefficient versus Reynolds number for the blunt bodies, and the lift coefficient versus Reynolds number for the NACA airfoil, enabling a comparative analysis of aerodynamic behavior across different geometries.
Keywords: Drag force, Blunt Bodies, Aerodynamic Bodies.
El objetivo del presente estudio es analizar la fuerza de arrastre y sustentación en cuerpos romos y aerodinámicos. Para ello se utilizó un túnel de viento y con objetos de diferentes geometrías como una esfera pequeña lisa, esfera grande lisa, esfera rugosa, disco y un cuerpo aerodinámico, para ser más específico un ala de perfil NACA. Luego se utilizó el ventilador para hacer circular aire en el interior del túnel de viento con diferentes porcentajes de velocidad de rotación de este; y con ayuda del software se tomaron cincuenta datos de fuerza de arrastre, viscosidad cinemática, temperatura, velocidad del aire en el interior del túnel subsónico. Se realizaron gráficas de coeficiente de arrastre vs número de Reynolds para cada cuerpo romo y el coeficiente de sustentación vs número de Reynolds para el perfil NACA.
Palabras claves: Fuerza de arrastre, Cuerpos Romos, Cuerpos Aerodinámicos.
The analysis of aerodynamic forces, specifically drag and lift, is fundamental in aeronautical and automotive engineering, as it determines the efficiency and stability of bodies in motion through a fluid. Blunt bodies, characterized by their non-aerodynamic shape, present a high drag coefficient due to early flow separation and the formation of turbulent wake vortices, resulting in reduced efficiency (Hucho & Sovran, 1993; Ladeesh & Manu, 2018). On the other hand, aerodynamic bodies designed to minimize resistance to movement optimize lift and reduce energy consumption(Dick, 1992).
The study of these forces allows understanding and predicting the behavior of different geometries under various flow conditions. Research has demonstrated that the shape of the object significantly influences flow distribution and, consequently, the forces generated (Wood, 2003). Additionally, factors such as the Reynolds number and surface roughness directly affect aerodynamic performance (Cavcar & Cavcar, 2003; Villa García, 2017).
Among the advantages of these studies is the possibility of optimizing designs to improve the energy efficiency and stability of vehicles and structures exposed to airflow (Castillo-Medina et al., 2025; HUANG, 1998; Schuster et al., 2023). Furthermore, the application of techniques such as computational fluid dynamics (CFD) allows for the simulation and analysis of flow behavior around different geometries, facilitating the development of innovative solutions.
However, there are associated challenges, such as the complexity of modeling turbulent flows and the need to validate simulations with experimental data obtained in wind tunnels. Furthermore, environmental conditions and fluid properties can introduce variations in the results, requiring detailed and careful analysis(Rivera López et al., 2025).
In this context, this study focuses on analyzing the drag and lift forces on blunt and aerodynamic bodies, using experimental and computational tools to evaluate their behavior under different flow conditions. The results obtained will contribute to the understanding of aerodynamic phenomena and the development of more efficient and sustainable designs.
Drag is the C_D that runs parallel to the flow. This force, so to speak, is the friction generated by the interaction between a solid body and the fluid through which it moves. There are also induced drags produced by the geometry of the solid. (Cadence, 2022) One effect that produces drag is the aerodynamic friction with the surface called the skin effect between the molecules of the air and those of the solid surface. A very smooth, waxy surface produces less drag due to this effect than a rough one. To calculate the drag force, the equation (1) is used:
| $$F_D=A\ast\ C_D\ast\frac{1}{2}\ast\rho\ast\ V^2$$ | (1) |
where:
\(A\): reflected area of the body
\(C_D\): drag coefficient
\(\rho\): fluid density
\(V\): fluid velocity
The drag force comprises the sum of two forces: the form drag, which is the result of the pressure gradients formed at the beginning and end of the body. The other is surface friction, which originates from the internal friction of the fluid.
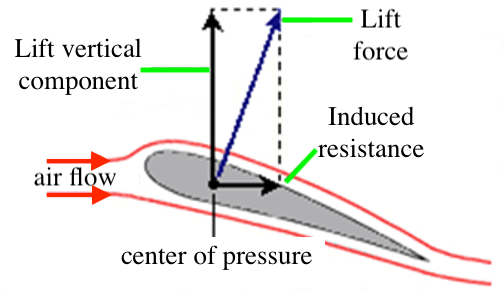
The Bernoulli effect is responsible for lift, where the sum of the static and dynamic pressures is constant when they meet at the same height in a fluid layer. Lift is the component of the net force (due to viscous and pressure forces) that is perpendicular to the flow direction (HUANG, 1998; Hui et al., 2021; van den Berg et al., 1957).
The air stream arrives at a certain speed, as shown in Figure 1: one above the wing and the other below; the geometry of the airfoil is such that the air speed above the wing is greater than that below it. Due to the Bernoulli effect, when a flow increases its speed, its pressure decreases. At the top of the airfoil, the pressure is lower, and the pressure differences result in a net force directed upward, which is the lift force.
| $$F_D=A\ast C_L\ast\frac{1}{2}\ast\rho\ast V^2$$ | (2) |
where:
\(A\): surface where lift is produced
\(C_L\): lift coefficient
\(\rho\): fluid density
\(V\): fluid velocity
The angle of attack, which is important for lift, must be defined and is the angle that forms the geometric chord of a wing profile with the direction of the incident air.
The study of the lift and drag force is considered important since it is used to determine experimental values in some projects or study of aerodynamics, such as aeronautics, it is essential to keep these issues in mind for the design, manufacturing and operation phases of an aircraft, the desired balance so that it meets all the required performance.
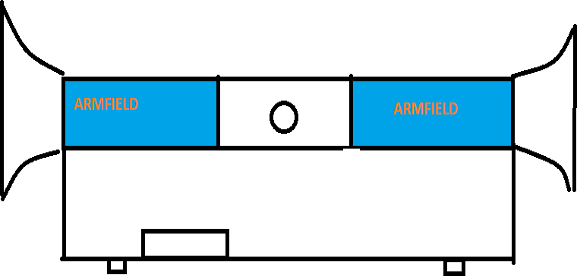
A C15-12-306 wind tunnel with an electronic manometer was used for data collection (see Figure 2). The system was activated by connecting the unit to the mains and setting the RCCB switch to ON. A USB cable was then used to connect the electronic manometer to the computer, verifying that the manometer's indicator lights were active. The IFD7 unit was turned on using the MAINS switch, as was the manometer.
Table 1. Equipment used.
| EQUIPMENT | Subsonic wind tunnel |
|---|---|
| BRAND | ARMFIELD |
| SERIE | 035003-001 |
Using the control software, the initial operating conditions were set. The "Fan ON" option was selected to activate the fan, and a starting speed of 20% was established. For each speed setting (increments of 20% until reaching 100%), aerodynamic variables were measured, collecting a total of 50 records for each speed level, with a sampling interval of one second between measurements. This procedure allowed for characterizing flow behavior under different operating conditions. Below are the representative calculations for obtaining the drag coefficients and lift coefficient of the aerodynamic bodies used in the study.
For the disk at 30% fan speed percentage.
\(F_D = 0.10 N\)
\(A = 0.001963 m^2\)
\(V = 8.5 m/s\)
\(\rho = 1.181 kg/m^3\)
| $$C_D=\frac{F_D}{\frac{1}{2}\ast A\ast\rho\ast V^2}$$ | (3) |
| $$C_D=\frac{0.10N}{\frac{1}{2}\ast0.001963\ m^2\ast1.181\frac{kg}{m^3}\ast{(8.5\frac{m}{s})}^2}=1.14095$$ |
\(\rho = 1.181 kg/m^3\)
\(V = 8.5 m/s\)
\(D = 0.05 m\)
\(u = 1.83x10⁻⁵ m^2/s\)
| $$R_e=\frac{\rho\ast V\ast D}{u}$$ | (4) |
| $$R_e=\frac{1.181\frac{kg}{m^3}\ast8.5\frac{m}{s}\ast0.05m}{1.83x{10}^{-5}m^2/s}=27427.6$$ |
The average of the 50 values for each ventilation percentage, which in this case is 30%, was then calculated and tabulated.
| $$F_D=\frac{F_{D1}+F_{D2}+F_{D3}+\ldots+F_{D50}}{50}=0.09N$$ | (5) |
For an angle of attack of 5.1
\(FL = 0.41 N\)
\(A = 0.0088 m^2\)
\(V = 15.1 m/s\)
\(\rho = 1.185 kg/m^3\)
| $$C_L=\frac{F_L}{\frac{1}{2}\ast A\ast\rho\ast V^2}$$ | (6) |
| $$C_L=\frac{0.41N}{\frac{1}{2}\ast0.0088\ m^2\ast1.185\frac{kg}{m^3}\ast\left(15.1\ m/s\right)^2}=0.3486$$ |
Representative calculations are found in the methodology section, below are the tables of results and graphs of drag coefficient vs. Reynolds for each geometry used.
Table 2. Air temperature and density, area of small smooth sphere.
| Temperature [oC] | Air density [kg/m3] | Area [m2] |
|---|---|---|
| 24 | 1.185 | 0.1421 |
Table 3. Average results for small smooth sphere of drag force, air speed, drag coefficient and Reynolds.
| % Fan speed | Fo[N] | V [m/s] | CD | Re |
|---|---|---|---|---|
| 60 | 0.08 | 22.7 | 0.003173 | 625197.5 |
| 70 | 0.16 | 23.3 | 0.00386 | 641811.9 |
| 80 | 0.26 | 25.9 | 0.004751 | 713044.4 |
| 90 | 0.38 | 30.3 | 0.005341 | 834498.8 |
| 100 | 0.50 | 34.1 | 0.00546 | 941067.8 |
Table 4. Air temperature and density, disk area.
| Temperature [oC] | Air density [kg/m3] | Area [m2] |
|---|---|---|
| 24 | 1.185 | 0.001963 |
Table 5. Average results for disk drag force, air speed, drag coefficient and Reynolds.
| % Fan speed | Fo[N] | V [m/s] | CD | Re |
|---|---|---|---|---|
| 30 | 0.09 | 8.4 | 1.15097 | 27178.45 |
| 40 | 0.22 | 11.6 | 1.42180 | 37432.02 |
| 50 | 0.36 | 14.2 | 1.49646 | 45731.82 |
| 60 | 0.54 | 16.8 | 1.59582 | 54209.82 |
| 70 | 0.75 | 19.6 | 1.60715 | 63309.21 |
| 80 | 0.99 | 22.6 | 1.59283 | 73086.74 |
| 90 | 1.35 | 27.1 | 1.61562 | 87561.05 |
| 100 | 1.67 | 29.9 | 1.61088 | 96510.57 |
Table 6. Air temperature and density, large sphere area.
| Temperature [oC] | Air density [kg/m3] | Area [m2] |
|---|---|---|
| 24 | 1.185 | 0.001987 |
Table 7. Average results for disk drag force, air speed, drag coefficient and Reynolds.
| % Fan speed | Fo[N] | V [m/s] | CD | Re |
|---|---|---|---|---|
| 60 | 0.11 | 18.6 | 0.265266 | 60564.32 |
| 70 | 0.23 | 21.3 | 0.418702 | 69242.69 |
| 80 | 0.35 | 24.6 | 0.466303 | 80096.54 |
| 90 | 0.47 | 28.1 | 0.482729 | 91723.57 |
| 100 | 0.62 | 32.4 | 0.498058 | 105717.2 |
Table 8. Air temperature and density, large sphere area.
| Temperature [oC] | Air density [kg/m3] | Area [m2] |
|---|---|---|
| 24 | 1.185 | 0.001987 |
Table 9. Average results for disk drag force, air speed, drag coefficient and Reynolds.
| % Fan speed | Fo[N] | V [m/s] | CD | Re |
|---|---|---|---|---|
| 40 | 0.03 | 12.7 | 0.13877 | 34856.65 |
| 50 | 0.12 | 16.0 | 0.38936 | 44184.99 |
| 60 | 0.14 | 18.5 | 0.03252 | 51167.17 |
| 70 | 0.10 | 22.0 | 0.18133 | 60880.18 |
| 80 | 0.11 | 25.6 | 0.14102 | 71038.19 |
| 90 | 0.17 | 28.9 | 0.16936 | 80030.11 |
| 100 | 0.26 | 33.4 | 0.20668 | 92065.88 |
Table 10. Air temperature and density, wing area.
| Temperature [oC] | Air density [kg/m3] | Area [m2] |
|---|---|---|
| 24 | 1.185 | 0.0089 |
Table 11. Average results for wing lift force, airspeed, lift coefficient and Reynolds.
| Angle of attack (\(\alpha\)) | Lift force [N] | V [m/s] | CL | Reynolds | CD |
|---|---|---|---|---|---|
| 5.1 | 0.44 | 15.1 | 0.4000 | 147310.00 | 0.0000 |
| 10.3 | 0.80 | 15.2 | 0.7000 | 148320.00 | 0.3000 |
| 15 | 0.95 | 15.0 | 0.8047 | 146893.00 | 0.0039 |
| 19.9 | 0.83 | 15.0 | 0.7053 | 146573.00 | 0.4103 |
| 25.2 | 0.89 | 15.0 | 0.7538 | 147000.00 | 0.5512 |
| 30.1 | 0.96 | 15.1 | 0.8082 | 147309.00 | 0.3732 |
| 35.2 | 1.15 | 14.9 | 0.9832 | 146169.25 | 0.6096 |
| 40.1 | 1.45 | 15.0 | 1.2330 | 146501.42 | 1.0384 |
| 44.9 | 1.68 | 15.2 | 1.4008 | 148236.00 | 1.2046 |
| 55.0 | 2.22 | 15.0 | 1.8793 | 146984.95 | 1.6870 |
For the smaller smooth sphere, the graphical analysis was performed starting at 60% of the fan speed because, at lower speeds (below 20%), no significant drag force was detected on its surface. This limitation is attributed to both the low flow intensity and the sensitivity of the data acquisition system, which did not record reliable force readings at very low speeds. In contrast, data were obtained from 30% to 100% of the speed, as the software correctly recorded the drag force values, attributable to the object's geometry, considering that the theoretical drag coefficient for a disk is approximately 1.1.
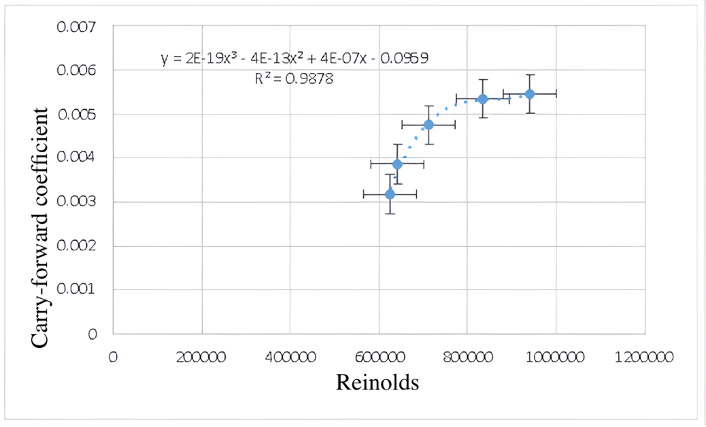
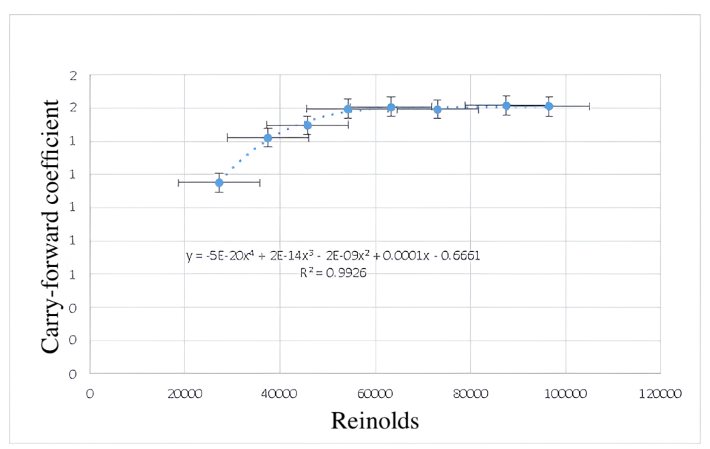
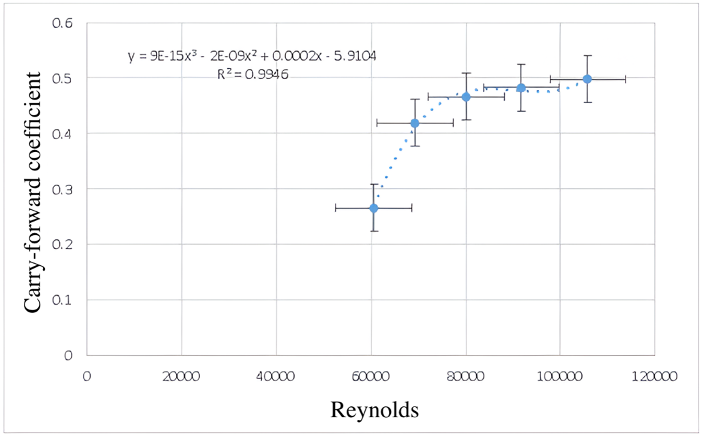
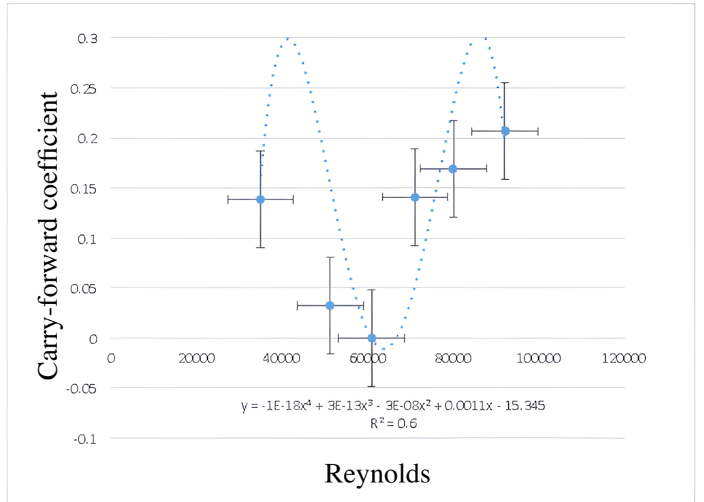
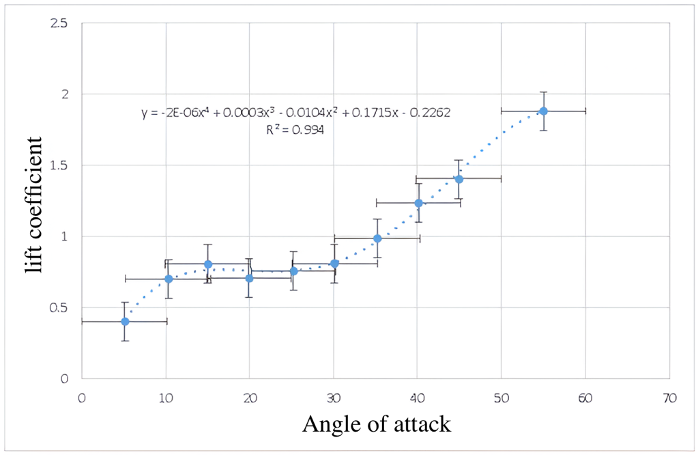
For the analysis of the experimental data, different polynomial regression models were applied based on the behavior of the scattering points. Specifically, the data for the small smooth sphere were fitted with a third-order polynomial trend, while those for the disk and rough sphere were fitted with fourth-order polynomials. The large smooth sphere was represented by a second-order polynomial trend. The rough sphere showed considerable dispersion in the data, attributable to the turbulence generated by its irregular surface; however, an increasing trend in the drag coefficient with respect to the Reynolds number was observed, a behavior common to all the geometries evaluated. Regarding the NACA airfoil, a direct proportional relationship was observed between the increase in the angle of attack and the increase in the lift coefficient.
Analysis of the NACA airfoil revealed that, as the angle of attack increases, the lift coefficient progressively increases until it reaches a critical value. From this point on, an abrupt loss of lift occurs, a phenomenon known as stall or aerodynamic roll. However, due to limitations of the experimental equipment in the laboratory, this behavior could not be fully observed empirically.
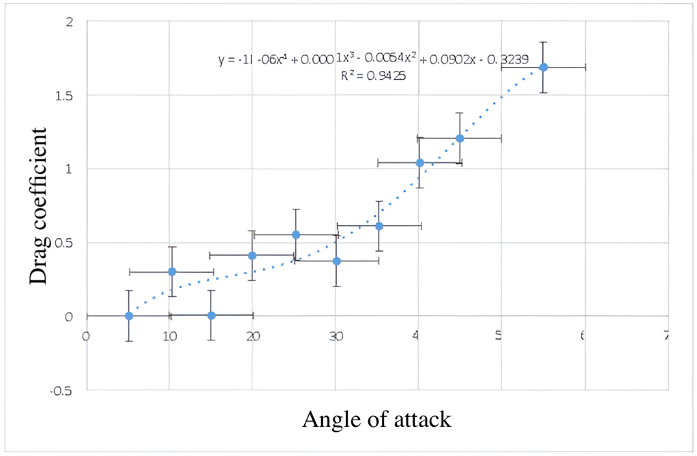
Drag coefficients were calculated for each of the studied geometries—smooth spheres, rough spheres, discs, and NACA airfoils—as a function of the Reynolds number. The results were represented graphically, allowing for the establishment of relationships between the body shape and its aerodynamic behavior under different flow conditions.
It is essential to avoid standing directly at the front or rear of the subsonic wind tunnel during testing. Standing at the rear could obstruct airflow into the system, disrupting flow uniformity, while standing at the front could pose a risk of injury from particles propelled by the high-speed air stream.
The electronic balance must be properly checked and calibrated before each test to ensure the accuracy of the aerodynamic force measurements.
The authors Universidad de Guayaquil and the Escuela Superior Politécnica del Litoral for its support.
The authos declared no potential conflicts of interest within this research, authorship, and/or publication of this article.
Castillo-Medina, A. G., Pineda-Silva, G. V., & Ribadeneira-Ramírez, V. S. (2025). Optimización aerodinámica de autobuses en Ecuador: eficiencia energética y sostenibilidad. Revista Metropolitana de Ciencias Aplicadas, 8(3), 232–240. https://doi.org/10.62452/e1kb1767
Cavcar, M., & Cavcar, A. (2003). Comparison of Generalized Approximate Cruise Range Solutions for Turbojet/Fan Aircraft. Journal of Aircraft, 40(5), 891–895. https://doi.org/10.2514/2.6879
Dick, E. (1992). Introduction to Finite Volume Techniques in Computational Fluid Dynamics. In Computational Fluid Dynamics (pp. 261–288). Springer Berlin Heidelberg. https://doi.org/10.1007/978-3-662-11350-9_11
HUANG, L. (1998). REVERSAL OF THE BERNOULLI EFFECT AND CHANNEL FLUTTER. Journal of Fluids and Structures, 12(2), 131–151. https://doi.org/10.1006/jfls.1997.0131
Hucho, W., & Sovran, G. (1993). Aerodynamics of Road Vehicles. Annual Review of Fluid Mechanics, 25(1), 485–537. https://doi.org/10.1146/annurev.fl.25.010193.002413
Hui, A., Oganesyan, V., & Kim, E.-A. (2021). Beyond Ohm’s law: Bernoulli effect and streaming in electron hydrodynamics. Physical Review B, 103(23), 235152. https://doi.org/10.1103/PhysRevB.103.235152
Ladeesh, V. G., & Manu, R. (2018). Machining of fluidic channels on borosilicate glass using grinding-aided electrochemical discharge engraving (G-ECDE) and process optimization. Journal of the Brazilian Society of Mechanical Sciences and Engineering, 40(6), 299. https://doi.org/10.1007/s40430-018-1227-0
Rivera López, J. E., Arciniega Martínez, J. L., Gutiérrez Paredes, G. J., Rodríguez Hibert, C. F., Martínez Cabrera, C. A., & Juárez Navarro, C. A. (2025). Estudio y medición experimental del coeficiente de arrastre del casco de un dron submarino por medio de un túnel de viento. Revista de Ciencias Tecnológicas, 8(1), 1–15. https://doi.org/10.37636/recit.v8n1e389
Schuster, W. R., Pezzin, S. H., & Lafratta, F. H. (2023). Airbrushing of carbon nanotubes on glass fibers for electromagnetic shielding epoxy composites. Polímeros, 33(2). https://doi.org/10.1590/0104-1428.20230001
van den Berg, Jw., Zantema, J. T., & Doornenbal, P. (1957). On the Air Resistance and the Bernoulli Effect of the Human Larynx. The Journal of the Acoustical Society of America, 29(5), 626–631. https://doi.org/10.1121/1.1908987
Villa García, L. M. (2017). Comparación entre la estimación de parámetros modales de estructuras a partir de análisis modal clásico y operacional con modificaciones de masa. Revista Internacional de Métodos Numéricos Para Cálculo y Diseño En Ingeniería, 33(3–4), 188–196. https://doi.org/10.1016/j.rimni.2016.04.003
Wood, R. (2003, January 6). Aerodynamic Drag and Drag Reduction. 41st Aerospace Sciences Meeting and Exhibit. https://doi.org/10.2514/6.2003-209