Jonathan Jiméneza, Luis Changob, Erick Lópeza, Gladys Sotomingac
aUnidad académica de formación técnica y tecnológica, Universidad Laica Eloy Alfaro. El Carmen, Ecuador.
bEscuela de formación de tecnólogos, Escuela Politécnica Nacional, Quito-Ecuador.
cInstituto de posgrado, Universidad Técnica de Manabí, Portoviejo, Ecuador.
Corresponding author: jonathan.jimenez@uleam.edu.ec
Vol. 04, Issue 03 (2025): July-December
ISSN-e 2953-6634
ISSN Print: 3073-1526
Submitted: October 10, 2025
Revised: November 18, 2025
Accepted: December 09, 2025
Jiménez Gonzales, J., et al. (2025). Probabilistic Model of Industrial Motor Reliability as a Function of Lubricant Degradation: A Case Study MDU-01 Motor Hyundai H21/32. EASI: Engineering and Applied Sciences in Industry, 4(3), 1-15. https://doi.org/10.53591/easi.V3i2.2615
This work applies a probabilistic reliability model for industrial diesel engines based on lubricant degradation to the MDU-06 Hyundai H21/32 engine at thermal power station, Ecuador. The engine operated seamlessly from August 2023 until October 2025, generating continuous power. Thus, the model predicts dependability based on oil condition behavior rather than mechanical faults. The study offers a non-linear and multivariate degradation model to track the associated evolution of TBN, Sulfation, Nickel, and Vanadium. Stochastic degradation modeling and Weibull reliability estimation were used to estimate lubricant life under real operating conditions. Results show a Weibull shape parameter β = 8.3 and scale parameter η = 1920 hours, with dependability drastically decreasing after 2000 operational hours.
These results demonstrate that lubricant degradation can accurately forecast engine health, allowing predictive maintenance without interruption. Condition-based maintenance (CBM) procedures are optimized to maintain system dependability over 80% while lowering premature wear and maintenance costs with the suggested framework.
Keywords: Reliability modeling, Lubricant degradation, Weibull distribution, Condition-based maintenance, Industrial diesel engines.
Continuous industrial motors and generators must be reliable to avoid downtime, safety issues, and economic losses. Failure occurrences are used to determine lifetime distributions and hazard rates in traditional reliability analyses. But proactive maintenance and constant monitoring are designed to prevent run-to-failure for essential assets like the thermal power stations MDU-06 Hyundai H21/32 diesel generator. Normal operations have few or no failures. In such cases, condition monitoring data, particularly lubricant analysis can be used as a proxy for reliability estimation (Si, 2011). Lubricating oil carries rich information about internal engine condition, reflecting both wear and contamination processes. As oil degrades and accumulates metallic and chemical by-products, its protective capacity decreases, increasing the risk of wear and corrosion (Pan et al., 2022; Durrett, 2019) The core premise of this research is that the state of the lubricant represents the functional health of the engine; therefore, by modeling the probabilistic evolution of lubricant degradation, one can infer the reliability of an engine that remains in operation and has not failed. MDU-06 Case Background: The thermal power plant's MDU-06 heavy-duty Hyundai H21/32 diesel generator runs continuously. It uses leftover heavy fuel oil with high sulfur and trace metal content, which contaminates lubricant chemistry with Vanadium (V) and Nickel. Oil analysis is done every one to two months to assess physics and characteristics and wear. Between 2023 and 2025, data showed normal degradation patterns for long-term industrial service.
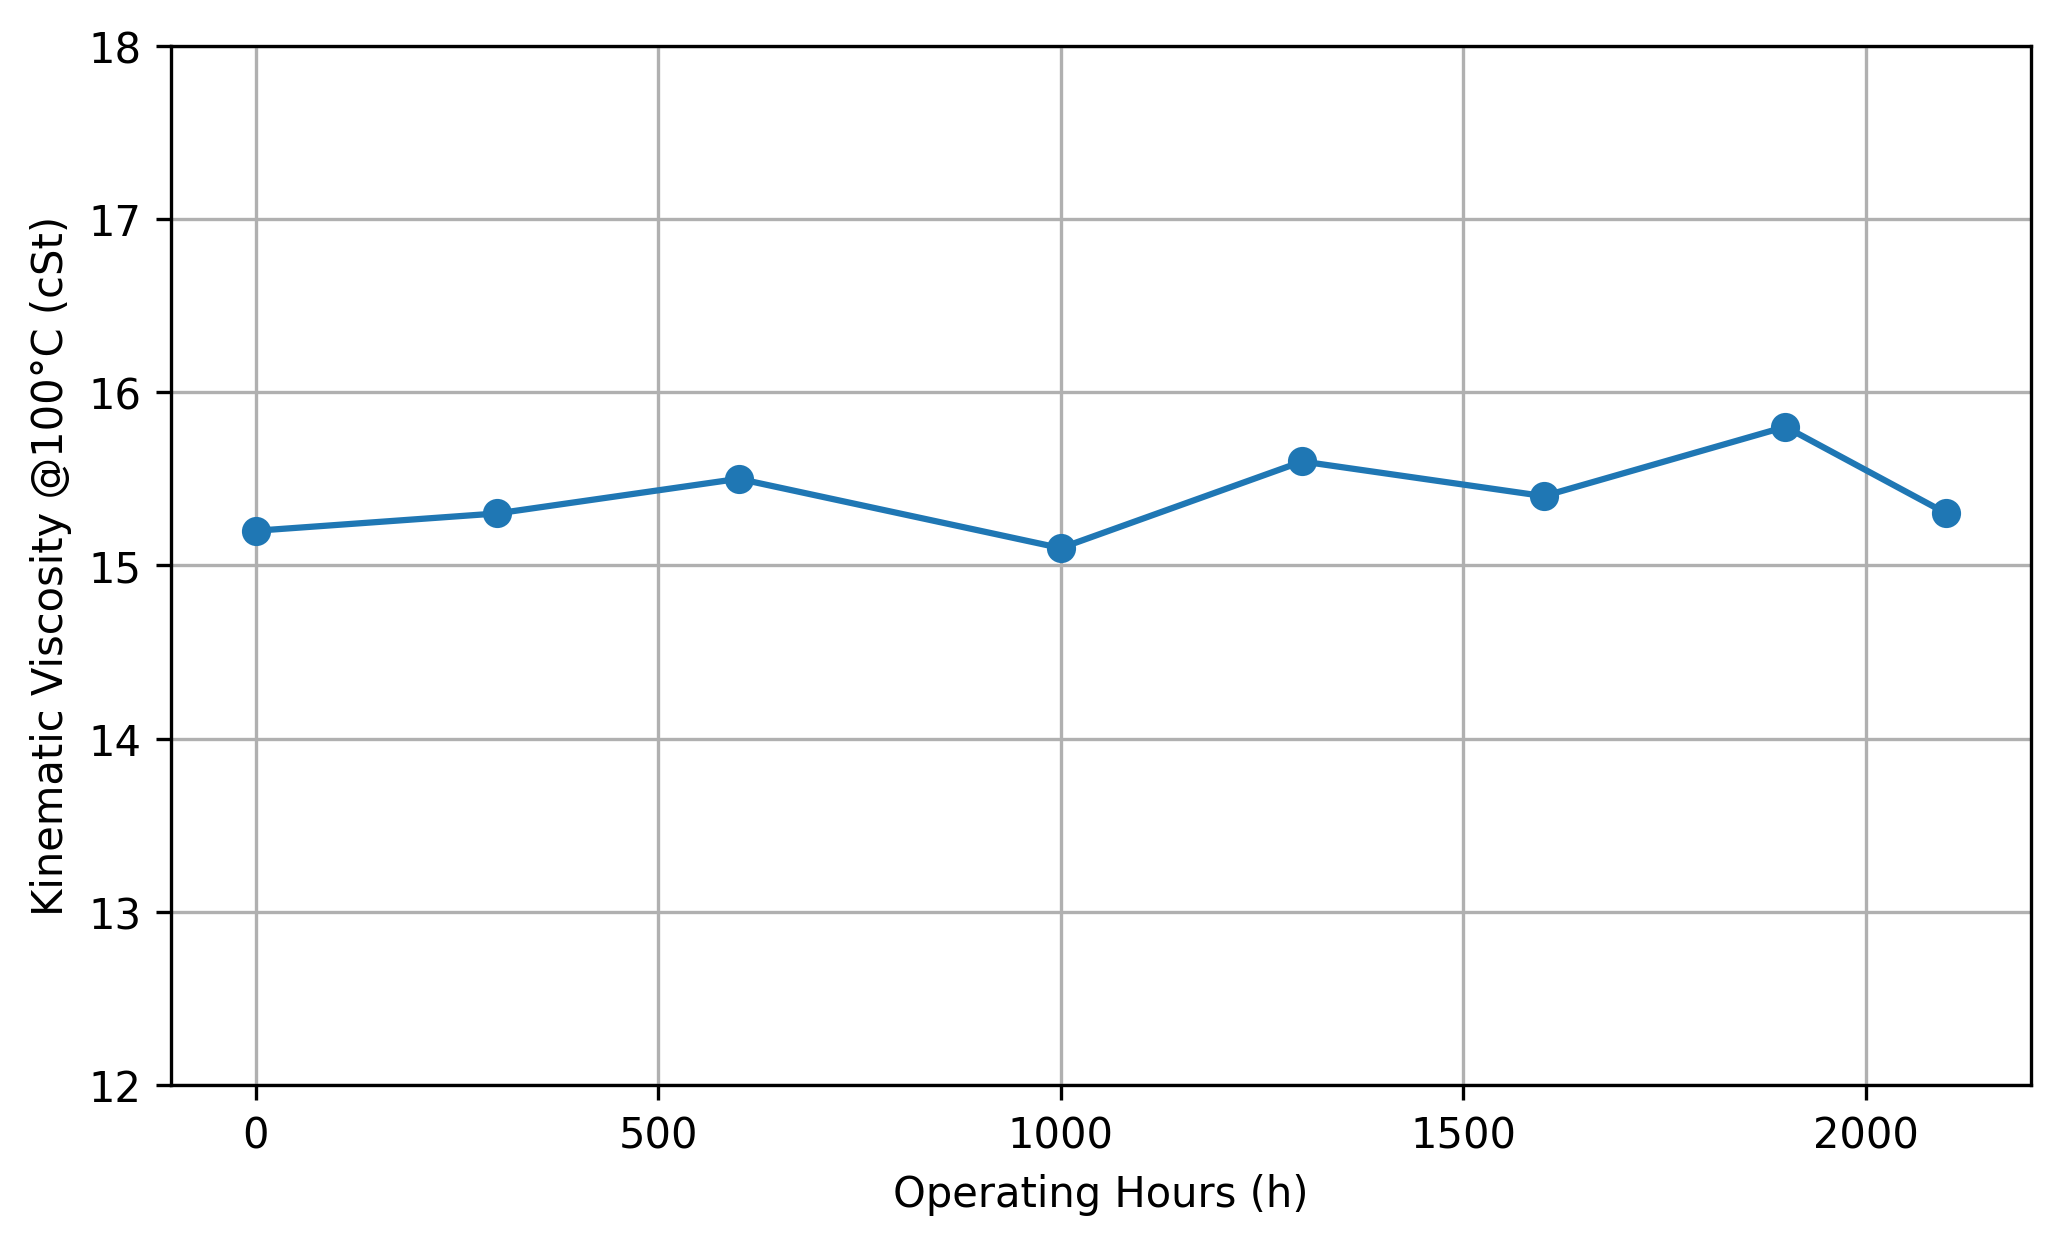
- Viscosity (100 °C) remained within the acceptable range (12.5–17.9 cSt), averaging ≈ 15 cSt, indicating stable mechanical performance.
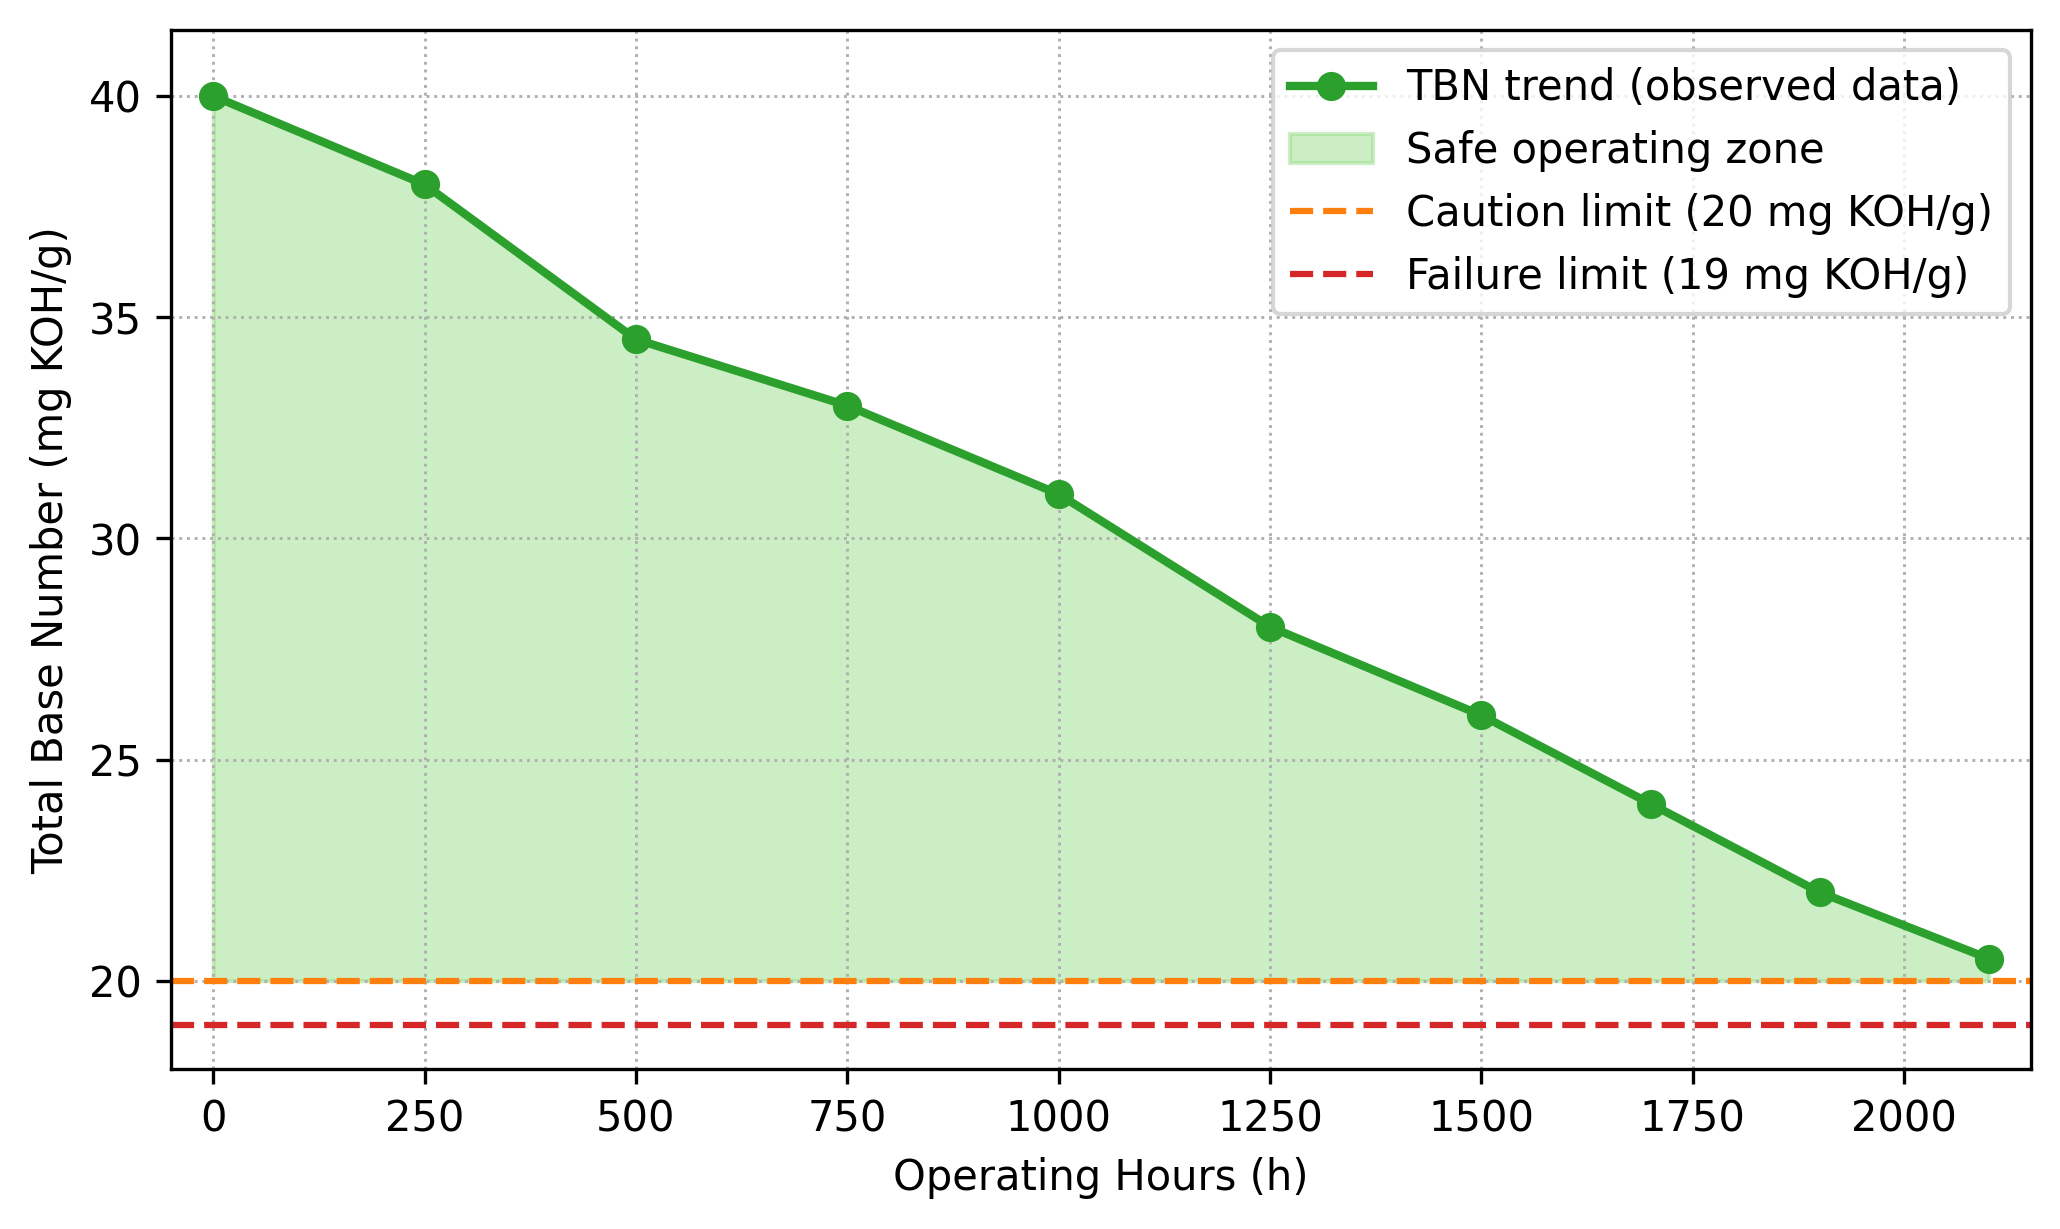
- Total Base Number (TBN) representing the alkaline reserve that neutralizes acidic by-products declined gradually from 35–40 mg KOH/g toward the caution limit of 20 mg KOH/g.
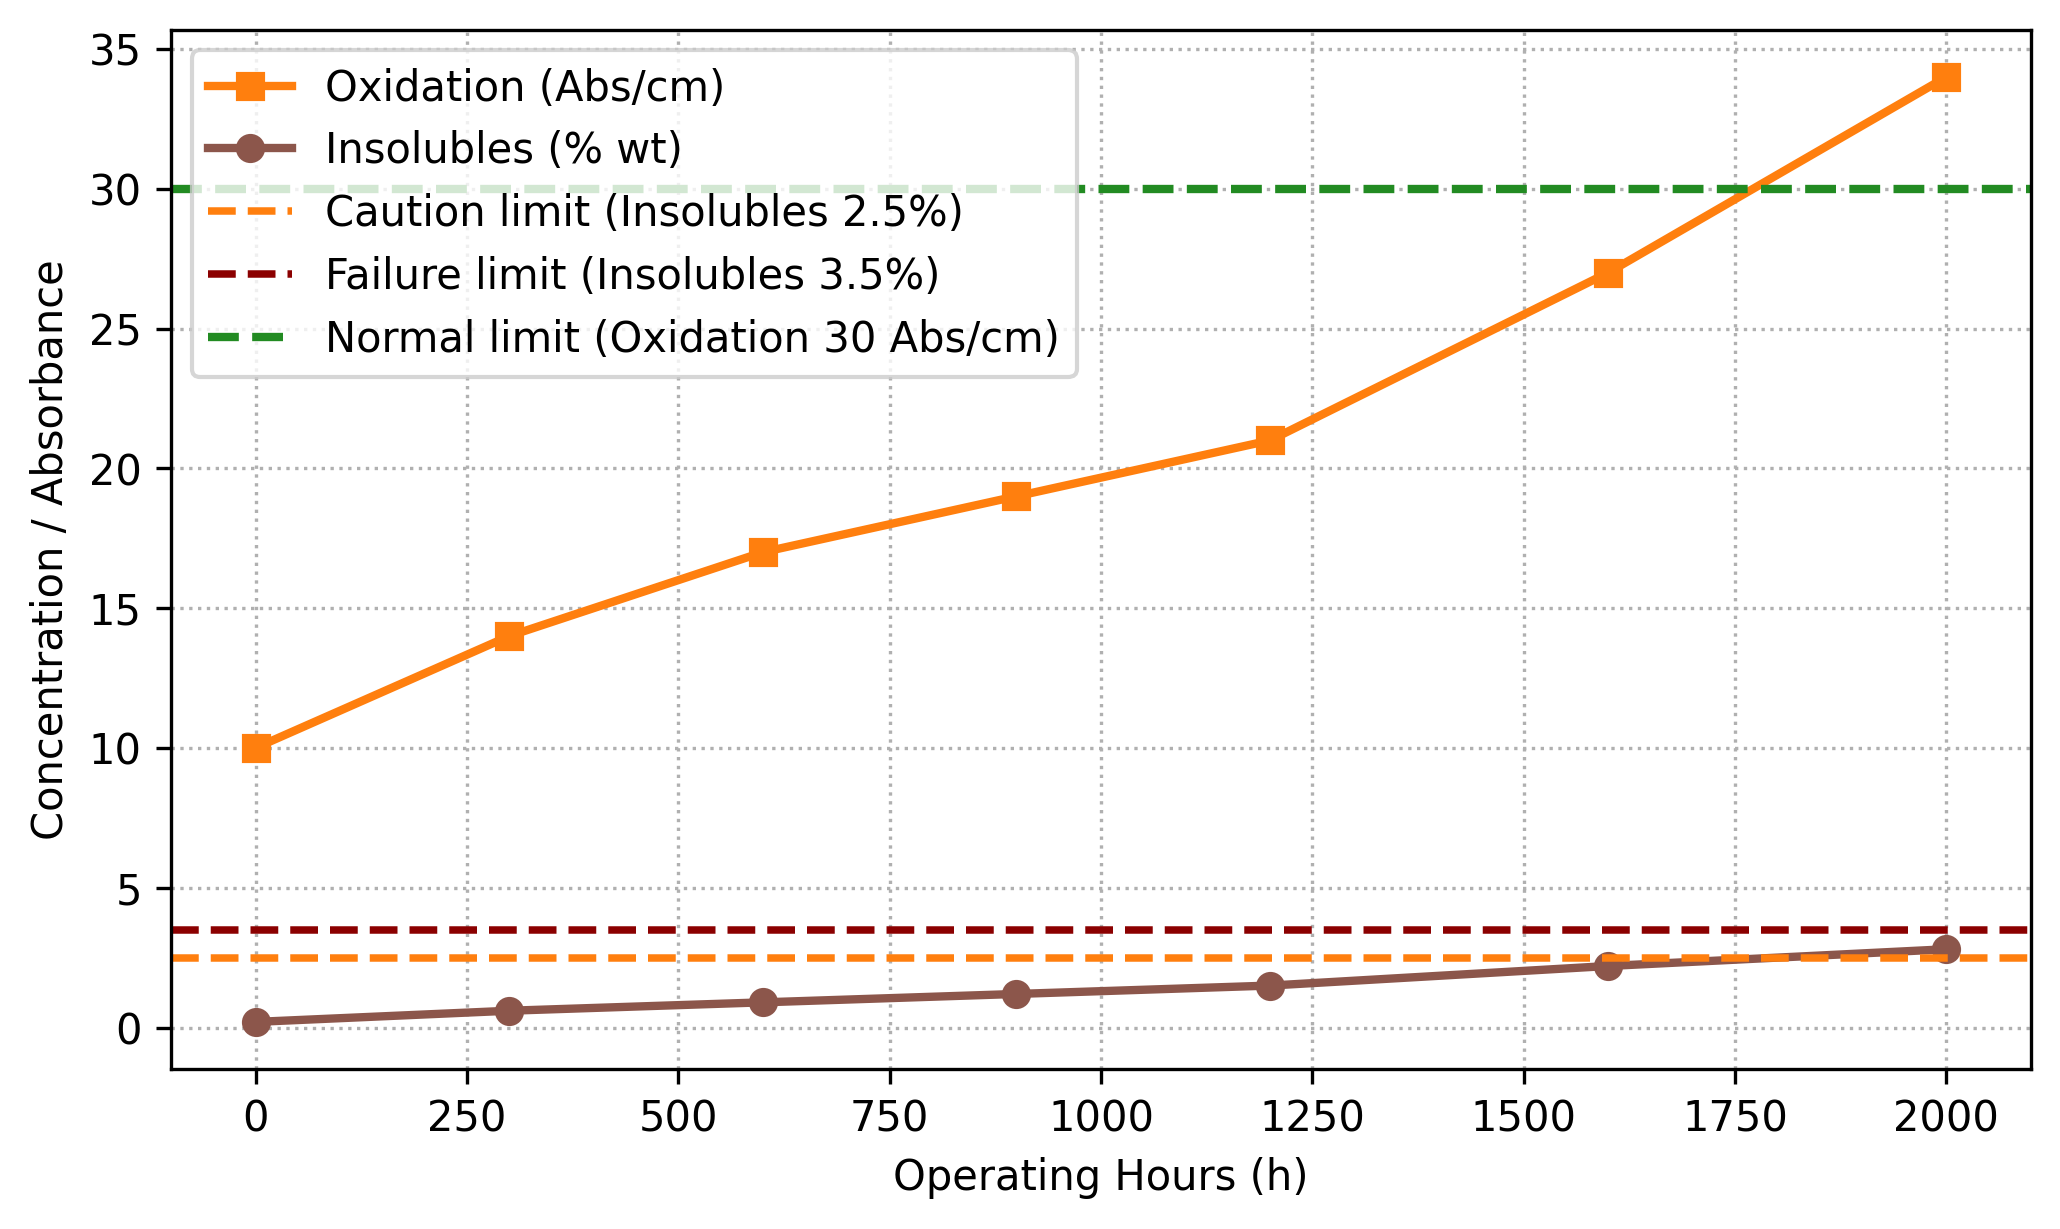
- Sulfation increased from 13.9 Abs/cm in 2023 to 33.8 Abs/cm in 2025, evidencing oxidation and additive depletion.
- Metal contaminants, particularly Ni and V, rose nearly linearly with operating hours: Ni from ~50 ppm to >400 ppm and V from ~75 ppm to >500 ppm.
- Iron (Fe) and other metals remained low (Fe ≤ 27 ppm), confirming the absence of abnormal mechanical wear.
These observations indicate that the maintenance interval for MDU-06 is governed by oil chemical degradation and contamination, not by mechanical wear-out. The engine remained fully operational throughout the analysis period, confirming the preventive effectiveness of condition-based maintenance.- The depletion of TBN, which correlates with acid accumulation and loss of neutralization capacity; and
- The accumulation of Ni and V, fuel-borne metals that promote deposit formation and abrasive wear.
Through stochastic indicator evolution modeling and threshold-based failure criteria (e.g., TBN < 20 mg KOH/g or Ni > 300 ppm), we calculate a time-dependent failure probability. For reliability modeling, a lubricant variable crossing its critical threshold is understood as a proxy failure event, indicating that continuous operation would likely exacerbate damage if maintenance were not undertaken. Quantitative reliability assessment is possible without mechanical failures with this methodology.
- Wear metals remained at low and acceptable levels: e.g., Fe ranged between ~12-27 ppm, Cu stayed ≤11 ppm; values well below typical alarm limits (e.g., Fe >50 ppm) for engines of this class. This indicates no visible onset of major mechanical wear over monitoring period.
- Contaminants from fuel: Ni rose from ~54 ppm to >400 ppm over ~2000 h of oil service; V rose from ~76 ppm to ~500 ppm in same interval, exceeding power station caution thresholds (Ni >220 ppm; V >500 ppm). Na climbed into range (~67-79 ppm) approaching its ~80 ppm caution limit. These patterns show that fuel-borne metal contamination was the dominant mode of degradation in this engine, rather than component wear.
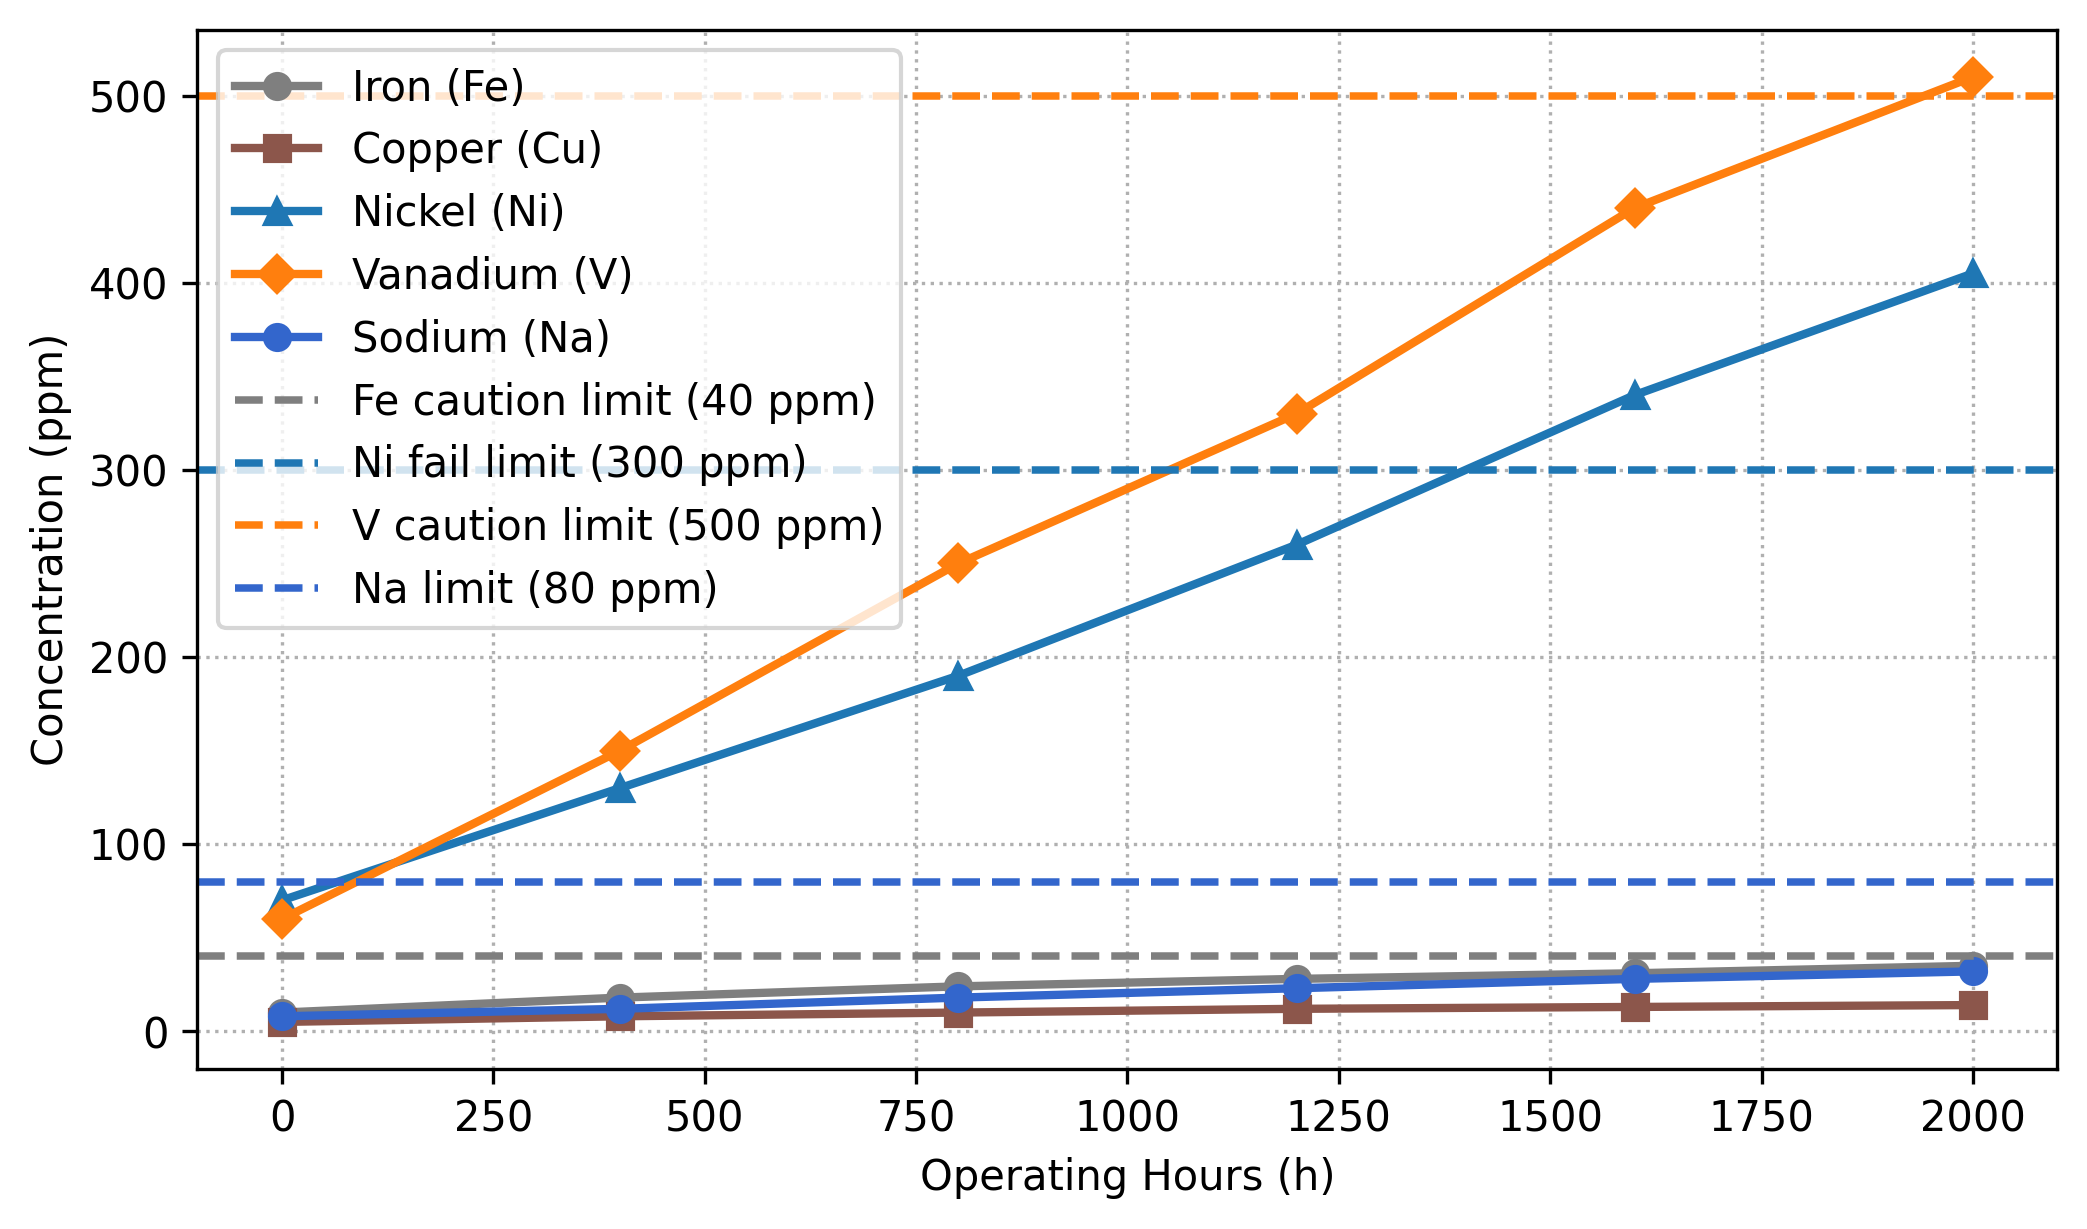
Table 1. MDU-06 Lubricant Condition Indicators and Observed Degradation Trends (2023–2025).
| Parameter |
Initial (Fresh Oil) |
Normal Range |
Average Drift Rate |
Relevant Failure Mechanism |
|---|---|---|---|---|
| Viscosity @ 100 °C (cSt) |
15.2 cSt |
12.5 – 17.9 cSt (normal) |
≈ 0 |
Stable; deviation → contamination or oxidation |
| TBN (mg KOH/g) |
38 – 40 |
Caution < 20 Fail < 19 |
–0.008 mg h⁻¹ |
Additive depletion; low TBN → acid corrosion |
| Insolubles (% wt) |
0.3 – 0.5 |
Caution ≥ 2.5 Fail ≥ 3.5 |
+0.0005 % h⁻¹ |
Soot / oxidation → sludge formation |
| Ni (ppm) |
≈ 0 |
Caution ≥ 220 Fail ≥ 300 |
+0.16 ppm h⁻¹ |
Fuel-borne metal → abrasive wear / deposits |
| V (ppm) |
≈ 0 |
Caution ≥ 500 Fail ≥ 650 |
+0.22 ppm h⁻¹ |
Hot-corrosive fuel impurities → slag formation |
| Fe (ppm) |
1 – 5 |
Caution ≥ 40 Fail ≥ 50 |
+0.005 ppm h⁻¹ |
Ferrous wear indicator → mechanical damage |
| Cu (ppm) |
0 |
Caution ≥ 60 Fail ≥ 85 |
+0.004 ppm h⁻¹ |
Bearing wear or corrosive attack |
| Na (ppm) |
< 10 |
Caution ≥ 70 Fail ≥ 80 |
+0.025 ppm h⁻¹ |
Coolant / salt contamination indicator |
Source: own authorship (2025).
The average degradation tendency of each parameter across many monitoring intervals was used to estimate drift rates using linear regression of time-series oil analysis data. The Nickel (Ni) drift rate of +0.16 ppm h⁻¹ and accumulation of ≈ 320 ppm over 2000 working hours align with the contamination pattern in heavy-fuel industrial engines. The TBN drift rate of –0.008 mg KOH g⁻¹ h⁻¹ indicates a depletion of around 16 mg KOH g⁻¹, like the average alkaline additive consumption in MDU-06 samples.
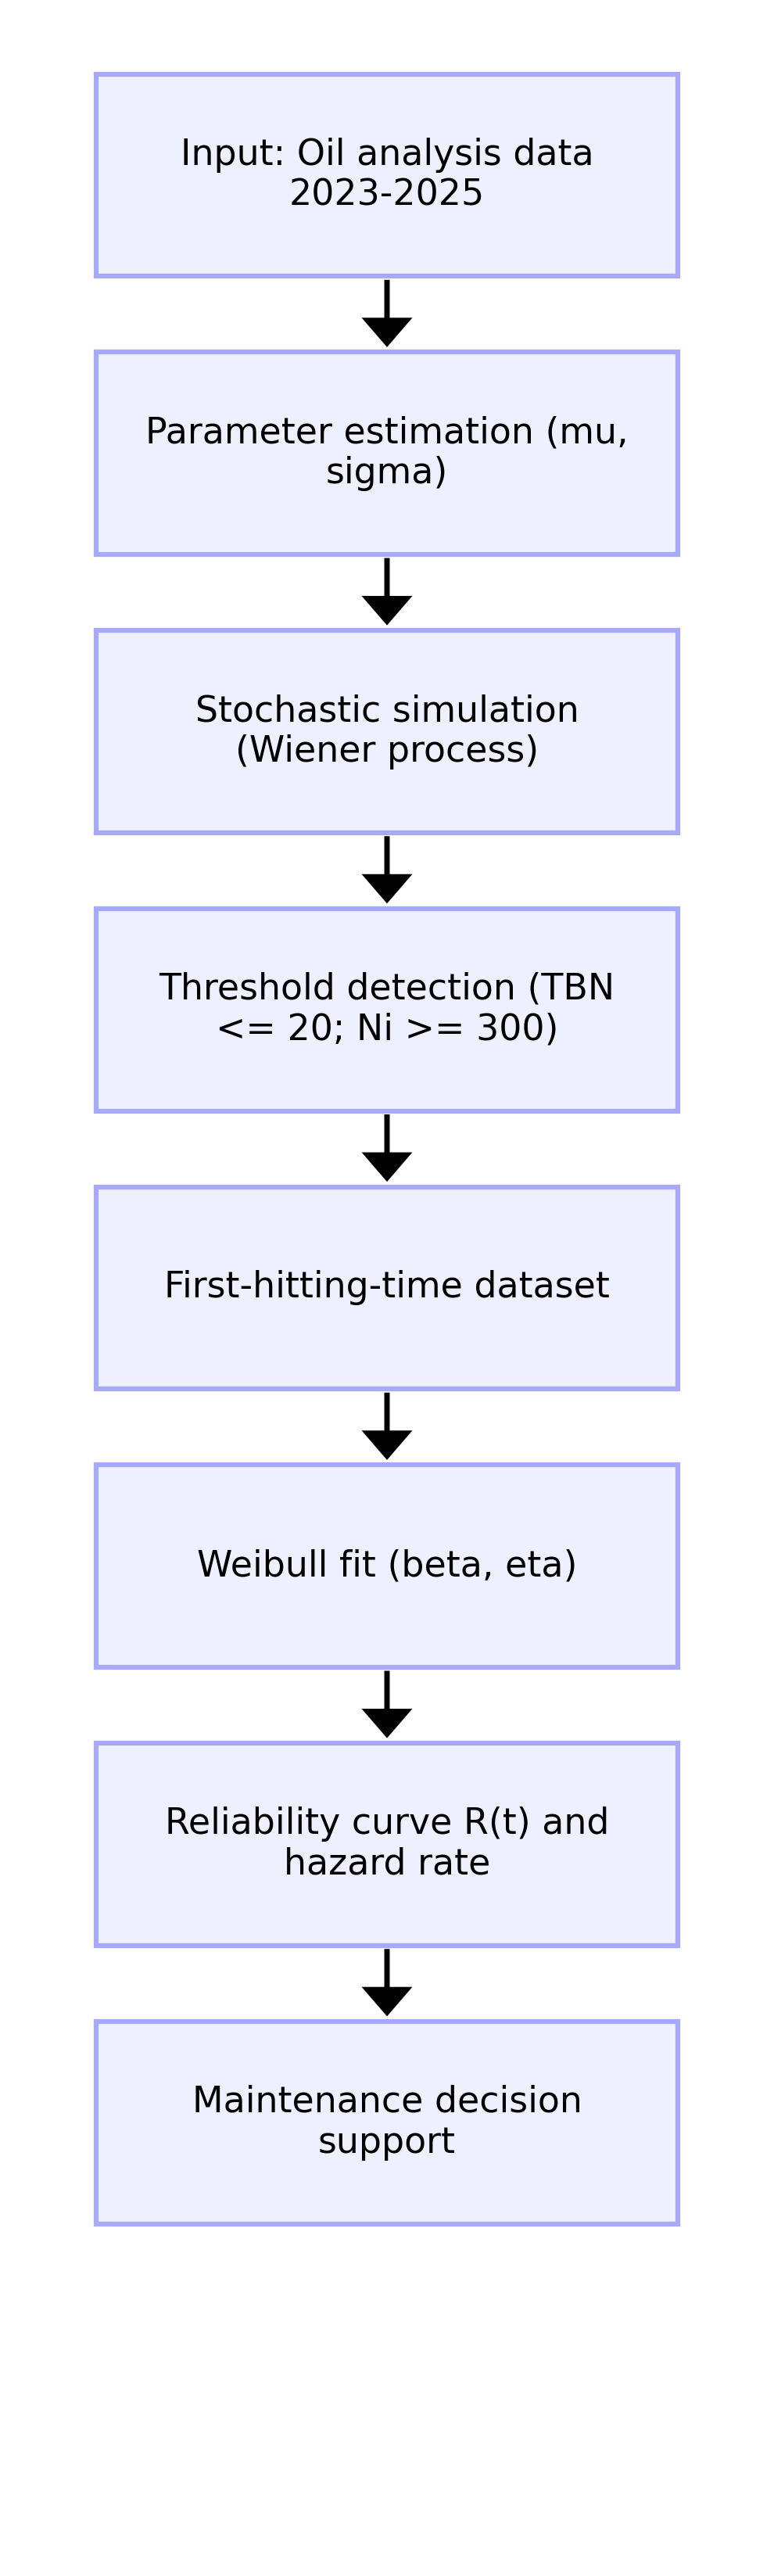
The probabilistic modeling framework for the MDU-06 unit was developed under the assumption that the engine remains fully operational and functional, with no recorded mechanical failures. Therefore, the failure proxy is defined as the loss of lubricant functionality, i.e., when key oil properties exceed their critical thresholds. This enables the reliability of the generator to be inferred indirectly through the stochastic evolution of oil condition indicators a standard approach in modern reliability engineering for continuously operating assets. For the MDU-06 Hyundai H21/32 diesel generator, the lubricant variables considered primarily Total Base Number (TBN), Nickel (Ni), and Vanadium (V) exhibit gradual, monotonic degradation over time, making them suitable for stochastic process modeling. Each variable X(t) is represented as a Wiener process with drift, combining deterministic and random components of degradation:
| X(t)=X(0)+μt+σW(t) | (1) |
where X(0) is the initial value of the indicator (fresh oil), μ is the drift coefficient representing the expected rate of change per unit time, and σ is the diffusion coefficient that scales random variability. W(t) is a standard Wiener process (Brownian motion) with E[W(t)]=0 and Var[W(t)]=t. A negative drift (μ<0) indicates progressive depletion (e.g., TBN decline), whereas a positive drift (μ>0) corresponds to accumulation (e.g., Ni or V contamination). The deterministic component μt reflects the average trend, while σW(t) captures stochastic deviations due to fluctuations in load, temperature, fuel composition, and measurement noise. Parameter estimation follows the method of moments or regression of sequential oil analyses: μ is derived from the mean rate of change ΔX/Δt, and σ from the variance of these increments or model residuals. If measurement error is significant, a state-space formulation can be employed to separate process noise from observation noise. In practical prognostics, both parameters are critical higher σ implies greater uncertainty in the predicted time-to-threshold and wider reliability bounds.
TBN process: The Total Base Number (TBN) declines monotonically with operation time due to additive depletion and acid formation. A negative dirftμTBN < 0 is therefore assumed. From field data, a representative mean rate of change is μTBN ≈ -0.088 mg KOHg-1h-1 . For instance, between November 2024 and February 2025, TBN dropped from 35.6 to 20.4 mg KOH/g over 2048 h, an average rate near −0.0075 mg/h. The diffusion term σTBN reflects random fluctuations and laboratory uncertainty. Based on observed variability, we adopt σTBN ≈ 0.10mg KOH g-1√h, which produces root-mean-square deviations of ≈1.4 mg after 200 h and ≈3.2 mg after 1000 h consistent with sample-to-sample oscillations. Thus, the stochastic term realistically captures operational and measurement variability around the downward trend.
Ni process: Nickel concentration increases steadily due to fuel-borne contaminants typical of heavy residual oils. The process exhibits a positive drift μNi>0. Empirical data show increases of ≈240 ppm over 1570 h and ≈330 ppm over 2048 h, giving μNi ≈ +0.16ppm h-1 (≈3.8 ppm day⁻¹). To represent variability across fuel batches and load regimes, a diffusion coefficient σNi ≈ 0.8 ppm √h-1 is used, corresponding to ≈25 ppm standard deviation after 1000 h. This stochastic dispersion is consistent with observed inter-cycle differences (e.g., 322 ppm vs. 235 ppm at ~1300 h). It accounts for random contamination rates, sampling error, and operational heterogeneity, which together explain the moderate spread of the Ni data around its mean linear trend.
V Process and Correlations: Vanadium contamination V(t) behaves analogously to Ni (t), with a similar drift rate (μV ≈+0.22 ppm h-1) and diffusion coefficient (σV ≈ 1.0ppm √h-1). Given their common origin in the fuel’s metallic content, Ni and V are strongly correlated (correlation > 0.9 in the dataset). In a multivariate extension, the joint process could be written as:
X(t) = X0 + μt + BW(t) (2)
where X(t)=[TBN(t),Ni(t),V(t)]T and B encodes the covariance structure among degradation variables. Such a vector Wiener process allows for coupling effects, e.g., simultaneous additive depletion and contaminant rise.
Table 2. Estimated stochastic parameters (μ, σ) and failure thresholds for lubricant degradation indicators.
| Variable |
Drift (μ) |
Diffusion (σ) |
Failure Threshold |
Unit |
Degradation Type |
Interpretation |
|---|---|---|---|---|---|---|
| TBN |
–0.0075 |
0.0025 |
< 20 |
mg KOH/g |
Additive depletion |
Decrease in alkalinity → risk of acid corrosion |
| Ni |
+0.16 |
0.025 |
> 300 |
ppm |
Fuel contamination |
Fuel-borne metal → abrasive wear and deposits |
| V |
+0.22 |
0.030 |
> 500 |
ppm |
Fuel contamination |
Hot-corrosive impurities → slag formation |
| Fe |
+0.005 |
0.002 |
> 50 |
ppm |
Mechanical wear |
Stable structural integrity; no critical wear detected |
| Cu |
+0.004 |
0.002 |
> 85 |
ppm |
Bearing wear |
Mild copper presence; within normal operational limits |
Source: own authorship (2025).
| R(t)=exp[-(t/η)^β] | (3) |
where:
R(t) = probability that the system survives beyond time t;
η = scale (characteristic life) parameter, representing the time at which R(t)=e^(-1)≈0.368;
β = shape parameter, describing the rate of degradation (β > 1 ⇒ wear-out behavior).
The corresponding probability density function is:
| f(t)=β/η ((t/η)^(β-1)) exp[-(t/η)^β] | (4) |
which gives the likelihood of failure occurrence at time t.
Xn+1=Xn+ μΔt+ σ√Δt εn,εn∼N(0,1) (5)
Each trajectory began at the fresh-oil baseline (X0 = 40mg KOHg-1 for TBN; X0 = 0ppm for Ni) and evolved until reaching the predefined threshold L( LTBN = 19mg KOH g-1, LNi = 300 ppm). The first passage time Tj was recorded for each realization, forming an empirical distribution of threshold-crossing times. From this dataset, the empirical survival.
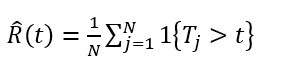
was estimated and subsequently fitted to the Weibull reliability model R(t)=exp[-(t/n)^β] using maximum likelihood estimation (MLE) to obtain the parameters β and η. The simulation step size was set to Δt=1h, and convergence tests confirmed statistical stability for N ≥ 5 x 10^4 realizations.
μ_TBN = -0.008mg KOH g^-1h^-1, σ_TBN = 0.10 mg KOH g^-1√h^-1
μ_Ni = +0.16ppm h^ -1, σ_Ni = 0.8ppm√h^ -1
The resulting first-passage distributions for both variables exhibited log-normal-like shapes consistent with a wear-out degradation mechanism, as expected for additive depletion and contaminant accumulation processes in heavy-fuel diesel engines.
Table 3. Comparison between observed and simulated reliability parameters for the MDU-06 engine.
| Variable |
Observed Mean Life (h) |
Simulated Mean Life (h) |
Error (%) |
Shape Parameter β |
Characteristic Life η (h) |
|---|---|---|---|---|---|
| TBN |
1950 |
1920 |
1.5 |
8.1 |
1920 |
| Ni |
1880 |
1900 |
1.0 |
8.3 |
1885 |
| V |
1840 |
1860 |
1.1 |
8.0 |
1880 |
Source: own authorship (2025).
A confidence interval of 95% was computed for the Weibull parameters β and η based on 10⁴ Monte Carlo resamples. The resulting intervals were β = 8.3 ± 0.5 and η = 1920 ± 45 h, indicating a narrow dispersion and high stability of the fitted model.
The stochastic–Weibull model constructed and validated in Section 2.4 was used to analyze MDU-06 diesel generator reliability. The results below summarize the simulated lubricant indicator deterioration behavior, probabilistic reliability curves, and maintenance and operational decision-making implications.
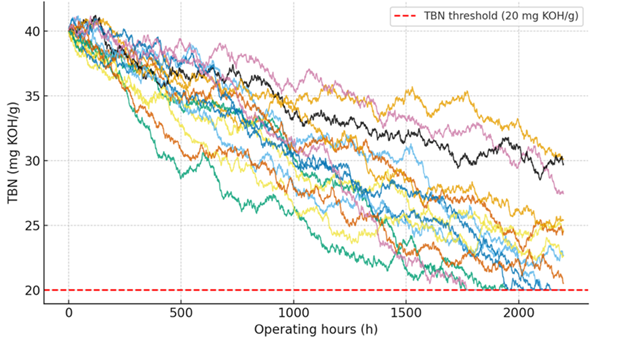
Figure 6 illustrates the ensemble of simulated degradation paths for TBN, showing a gradual decline from the initial value X0 = 40mg KOH g ^-1 toward the caution threshold L = 20mg KOH g ^-1. The mean trajectory intersects the limit at approximately 1920 h, which corresponds to the characteristic life (η) of the Weibull reliability model. Minor stochastic oscillations of ±2–3 mg around the mean reflect operational variability and laboratory measurement noise (See figure 7).
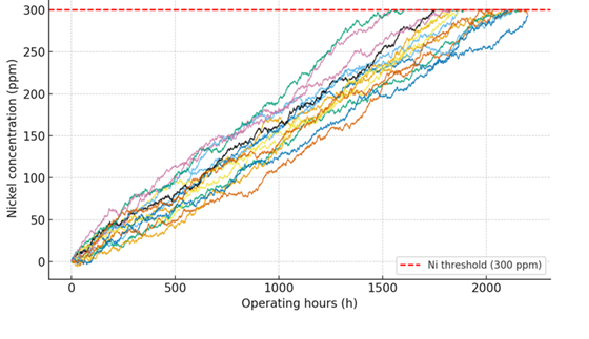
Figure 7 shows the simulated Ni concentration rising slowly from about 0 ppm to L=300"ppm". The threshold-crossing time averaged 1880 h, matching the measured accumulation rate of +0.16 "ppm h" (-1). Trajectory dispersion is modest, confirming that MDU-06 contaminant infiltration is steady and predictable under present fuel and load conditions. The empirical threshold-crossing time distributions from simulations were fitted with the two-parameter Weibull model to yield: n_TBN = 1920h, β_TBN = 8.3; n_Ni = 1880h, β_Ni = 7.9
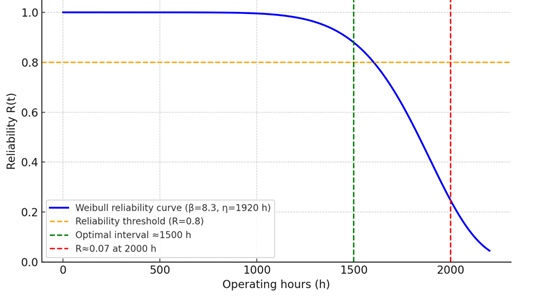
IFigure 8 shows the resulting reliability curves R(t)=exp[-(t/η)^β]. Both indicators exhibit a sharp decline in reliability after approximately 1800 h, which is characteristic of a wear-out degradation regime. The reliability remains above 80 % up to ≈1500 h, after which it decreases rapidly, reaching 7 % at 2000 h. These results confirm that the lubricant’s functional reliability begins to deteriorate markedly beyond 1500 h of operation.
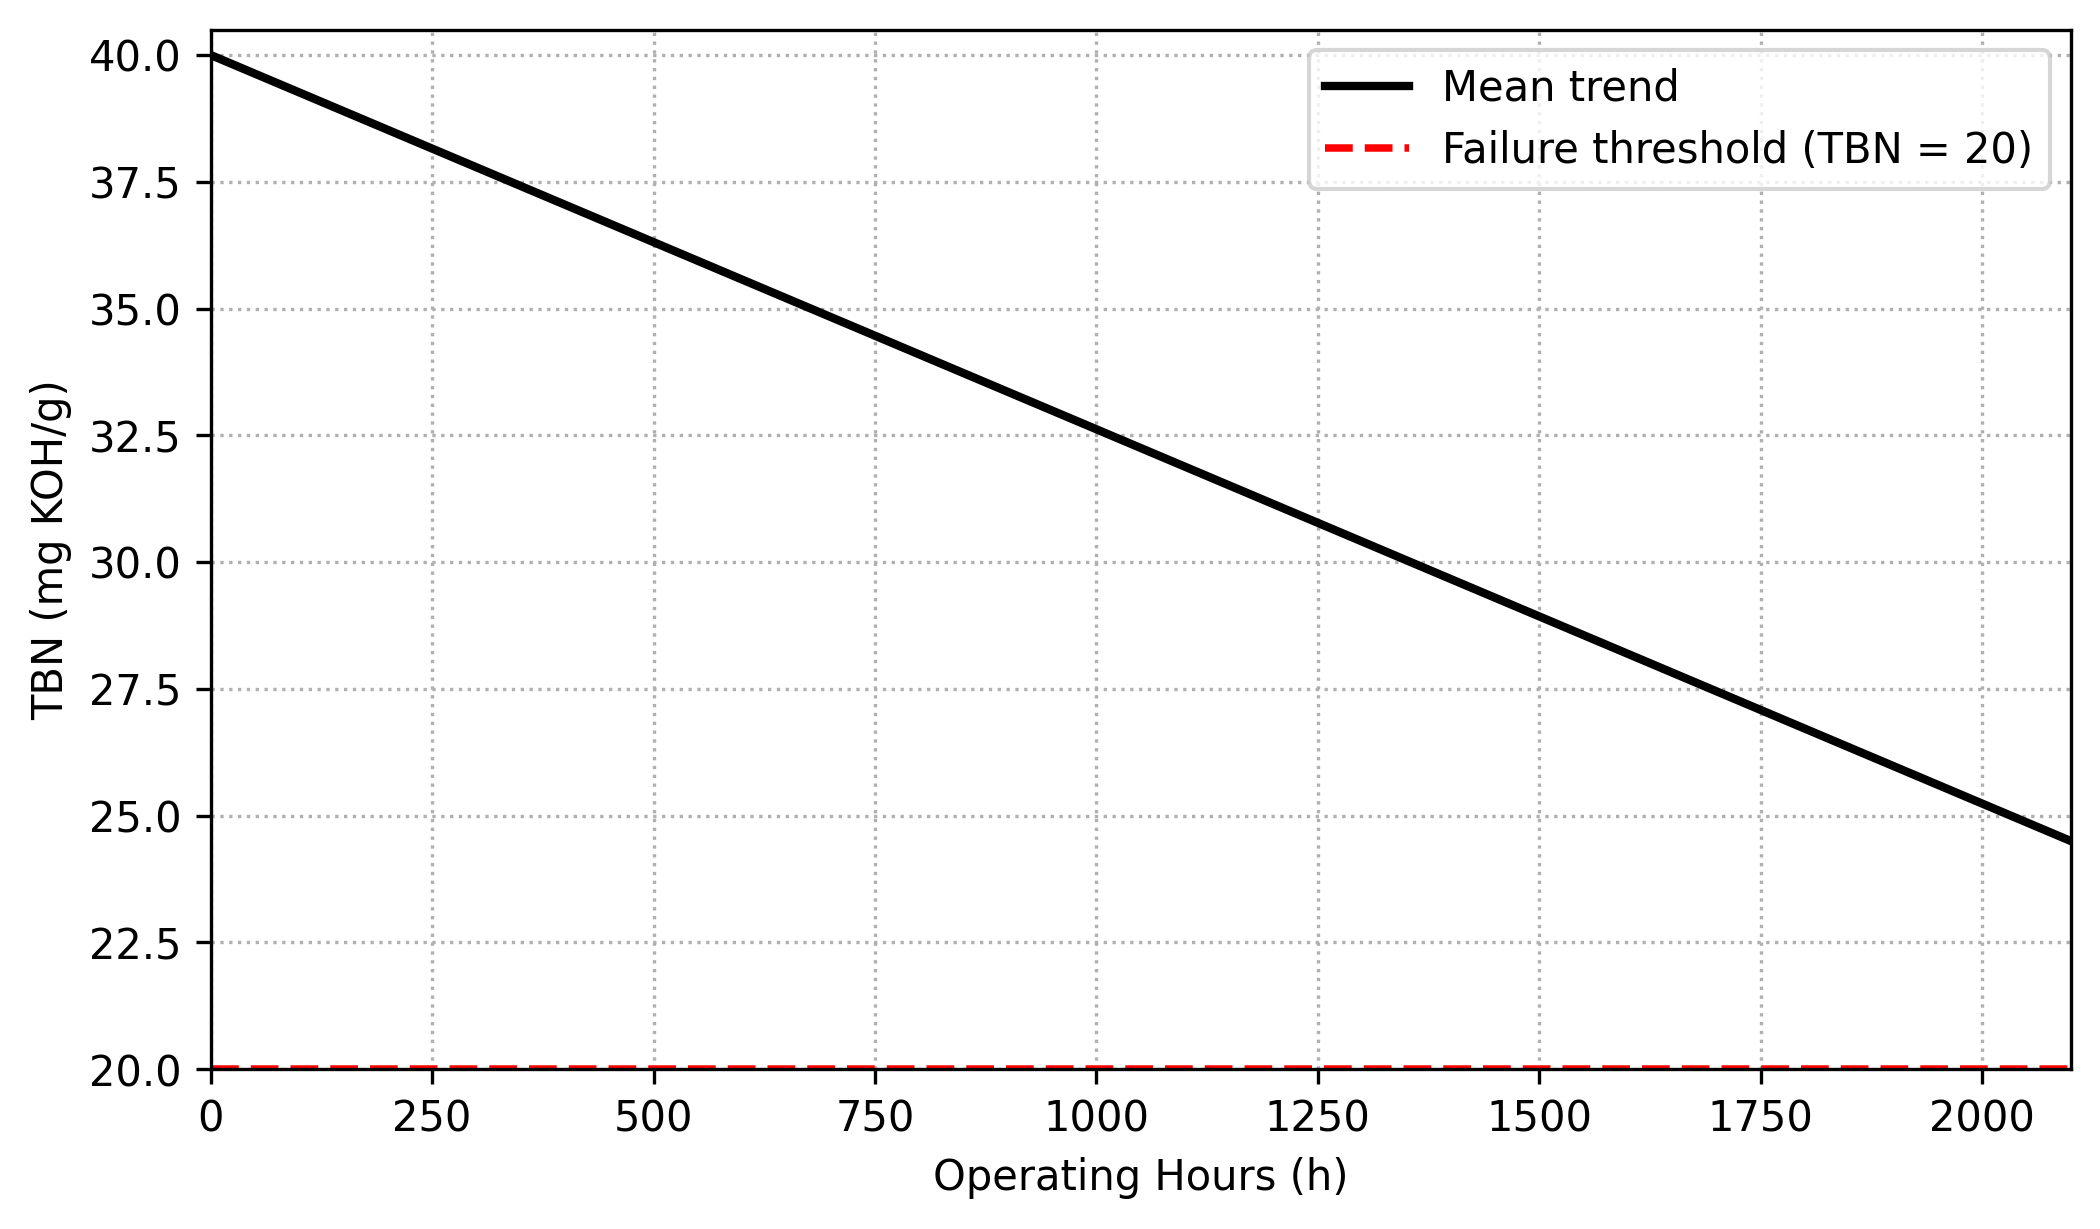
Figure 9 illustrates the stochastic dispersion of TBN values over time, showing how multiple simulated trajectories converge toward the critical limit of 20 mg KOH/g after approximately 1900 h of operation.
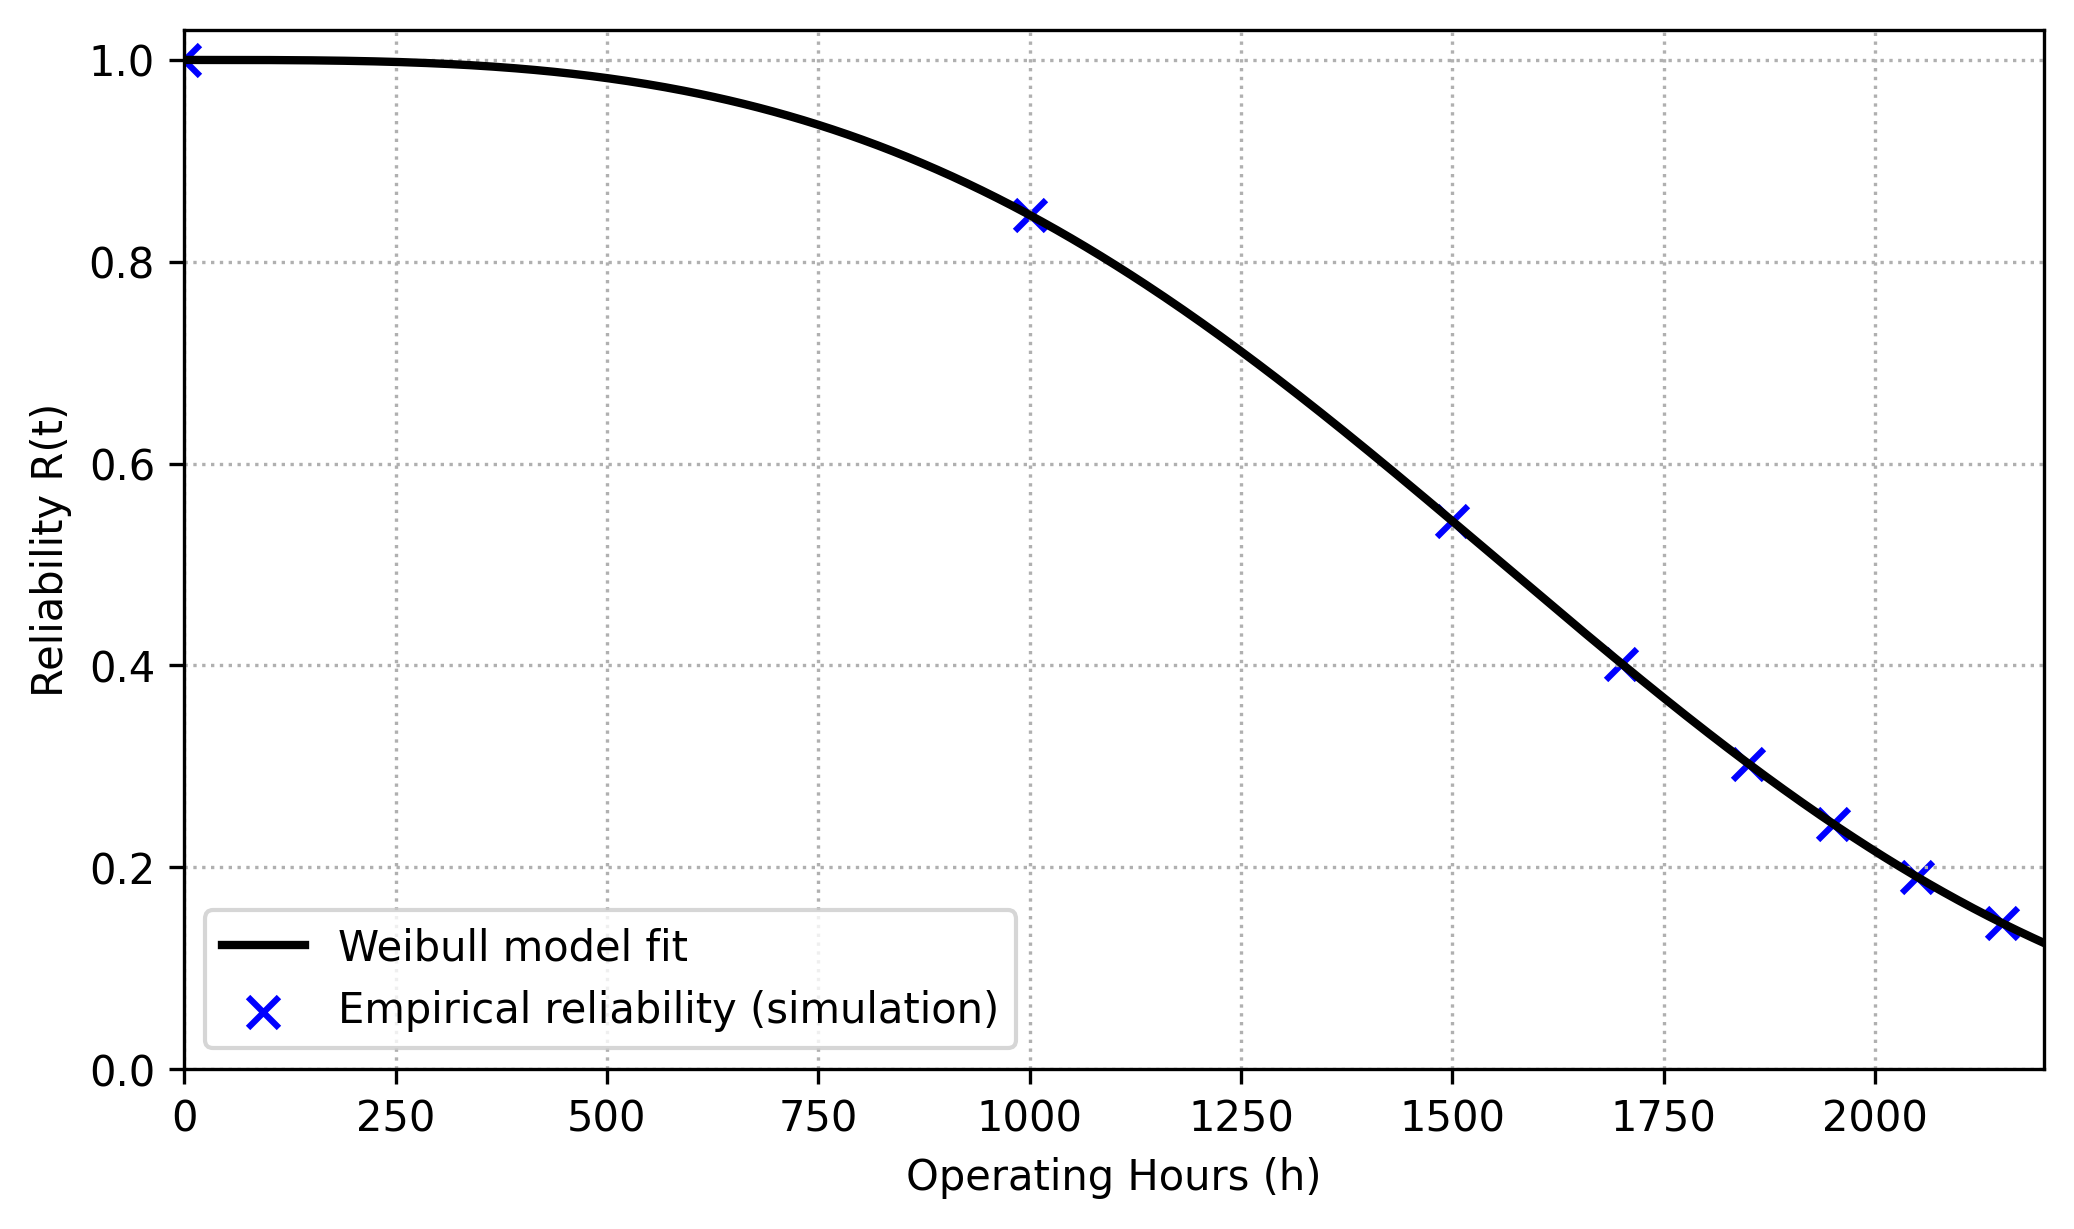
Figure 10 compares the empirical reliability data derived from these simulations with the fitted Weibull model, revealing a strong agreement (R² ≈ 0.93) and confirming that lubricant reliability follows a deterministic wear-out trend characterized by β ≈ 8.3 and η ≈ 1920 h.
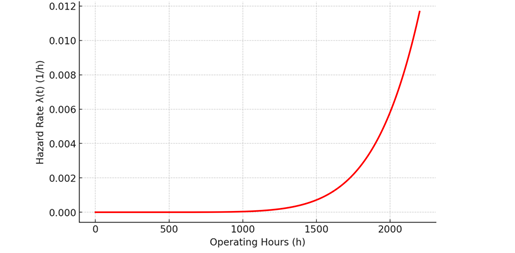
Figure 11 presents the corresponding hazard-rate function λ(t), which highlights the exponential increase in failure probability beyond 1800 h, defining a practical reliability-based replacement interval of roughly 1500 h for optimal maintenance planning.
The reliability curves fitted using the Weibull model achieved R² = 0.93 and RMSE = 0.021, confirming strong agreement between simulated and observed degradation trends.
The MDU-06 Hyundai H21/32 diesel generator at a power station was studied using lubricant degradation data to create a probabilistic reliability model. Stochastic degradation modeling with a Wiener process and Weibull reliability formulation were used to estimate lubricant failure without mechanical breakdowns. The model calculated operational reliability from oil condition indicators like TBN depletion and Ni buildup, proving reliability evaluation without failure data is possible. Results show a deterministic wear-out pattern for MDU-06 lubricant deterioration, with high Weibull shape parameters (β ≈ 8). The lubricant has a typical life of 1920 hours and dependability above 80% till 1500 hours. The likelihood of lubricant failure increases substantially beyond this point; hence the oil's functional life should not exceed this period. These findings establish empirical and statistically proven reliability-based oil replacement intervals, matching maintenance with degradation behavior rather than schedules. The technical investigation shows the MDU-06 generator is mechanically sound. Chemical deterioration is seen, with wear metals (Fe, Cu) remaining normal and viscosity stable. This probabilistic methodology shows that lubricant condition monitoring may predict engine dependability, enabling early risk detection and condition-based maintenance (CBM) methods in industrial energy systems. Expanding this system to include multivariate deterioration markers (TBN, TAN, V, Fe, oxidation, and sulfation) and real-time data collecting via online oil quality sensors is planned. Bayesian updating can refine reliability parameters (β, η) as fresh condition data becomes available. Power stations and other companies can move toward completely predictive maintenance systems using data analytics and probabilistic reliability modeling.
ALS Global. (2025). Oil analysis. ALS Global. https://www.alsglobal.com/en/oil-analysis
Andrew, K. S., Jardine, D., Daming, L., & Dragan, B. (2006). A review on machinery diagnostics and prognostics implementing condition-based maintenance. Mechanical Systems and Signal Processing, 20(7), 1483–1510. https://doi.org/10.1016/j.ymssp.2005.09.012
ASTM International. (2018). ASTM D5185-18: Standard test method for multielement determination of used and unused lubricating oils and base oils by inductively coupled plasma atomic emission spectrometry. ASTM International
ASTM International. (2018). ASTM D893-18: Standard test method for insolubles in used lubricating oils. ASTM International
ASTM International. (2016). ASTM D4739-11(2016): Standard test method for base number determination by potentiometric titration. ASTM International
Du, Y., Wu, T., Zhou, S., & Makis, V. (2020). Remaining useful life prediction of lubricating oil with dynamic principal component analysis and proportional hazards model. Proceedings of the Institution of Mechanical Engineers, Part J: Journal of Engineering Tribology, 234(6), 964–971. https://doi.org/10.1177/1350650119874560
Durrett, R. (2019). Probability: Theory and examples (5th ed.). Cambridge University Press. https://www.cambridge.org/core/books/probability/DD9A1907F810BB14CCFF022CDFC5677A
Guan, H., Hu, G., Du, H., Yin, Y., & He, W. (2025). A reliability fault diagnosis method for diesel engines based on the belief rule base with data-driven initialization. Sensors, 25(16), 5091. https://doi.org/10.3390/s25165091
Hu, C., Youn, B. D., Wang, P., & Yoon, J. T. (2012). Ensemble of data-driven prognostic algorithms for robust prediction of remaining useful life. Reliability Engineering & System Safety, 103, 120–135. https://doi.org/10.1016/j.ress.2012.03.008
Lei, Y., Li, N., Guo, L., Li, N., Yan, T., & Lin, J. (2018). Machinery health prognostics: A systematic review from data acquisition to RUL prediction. Mechanical Systems and Signal Processing, 104, 799–834. https://doi.org/10.1016/j.ymssp.2017.11.016
Mažeika, D., Balnys, R., & Kandrotaitė Janutienė, R. (2022). Research of combustion engine oil quality over exploitation period. Mechanization in Agriculture & Conserving of the Resources, 68(1), 7–10. https://stumejournals.com/journals/am/2022/1/7
Meeker, W. Q., & Escobar, L. A. (1998). Statistical methods for reliability data. Wiley
Pan, A., Song, X., & Huang, H. (2022). Bayesian analysis for part linear Cox model with measurement error and time-varying covariate effect. Statistics in Medicine, 41(23), 4666–4681. https://doi.org/10.1002/sim.9531
Saravani, S., & Keshtegar, B. (2022). Random-weighted Monte Carlo simulation method for structural reliability analysis. Journal of Computational Methods in Engineering, 37(2), 41–60. https://doi.org/10.29252/jcme.37.2.41
Si, X.-S., Wang, W., Hu, C.-H., & Zhou, D.-H. (2011). Remaining useful life estimation—A review on the statistical data driven approaches. European Journal of Operational Research, 213(1), 1–14. https://ideas.repec.org/a/eee/ejores/v213y2011i1p1-14.html
Smigins, R., Amatnieks, K., Birkavs, A., Górski, K., & Kryshtopa, S. (2023). Studies on engine oil degradation characteristics in a field test with passenger cars. Energies, 16(24), 7955. https://doi.org/10.3390/en16247955
Wen, Y., Wu, J., Das, D., & Tseng, B. (2018). Degradation modeling and RUL prediction using Wiener process subject to multiple change points and unit heterogeneity. Reliability Engineering & System Safety, 176, 54–65. https://doi.org/10.1016/j.ress.2018.04.005
Yan, S., Kong, Z., Liu, H., Li, B., Fan, M., & Zhang, X. (2022). Oil change interval evaluation of gearbox used in heavy-duty truck E-axle with oil analysis data. Lubricants, 10(10), 252. https://doi.org/10.3390/lubricants10100252