1. INTRODUCTION
Climatological variation due to global warming has signified climatological changes at the regional level. Thus, in recent years, several studies have been conducted, estimating various possible global and regional impacts in different sectors and scenarios in which different types of emissions are studied (Arnell et al., 2019; Barange et al., 2018; O’Neill et al., 2018; Sesana et al., 2021). In particular, local temperature and precipitation patterns are expected to deviate significantly from current levels in the event of significant future global warming.
Different studies have been performed on the possible global and regional impacts due to different temperature levels. Thus, (Adwan et al., 2021; Arnell et al., 2016; Masson-Delmotte et al., 2018) relate the impact of temperature change by scaling patterns, expressed as climate models. Solazzo et al., have performed a diagnostic evaluation of different models, using classical statistical indicators to evaluate observations of climatological variables (2017). That is, with the aim of performing statistical analysis, and achieving a nearer calibration in the measurement relating the various climatological variables, various methods such as multiple linear regression (MLR), nonlinear programming (NLP) and canonical correlation analysis (CCA) have been applied (Busuioc et al., 2006; Tukimat et al., 2019).
However, because the data from the different climatological variables maintain stochastic characteristics, the relationships are not easily distinguishable through simple linear statistics. Therefore, it is necessary to apply methods that allow showing the nonlinear relationships between the different variables simultaneously. Thus, in (Jin et al., 2005), nonlinear relationships and temporal variation between temperature and precipitation are studied using a multivariate dynamic approach, focused on chaos theory. The multivariate approach can result from multiple types of variables, rather than multiple sites (Miao et al., 2023; Renard et al., 2022; Zscheischler et al., 2018), then, the dependence between variables is usually described by specific models of extremes (Favre et al., 2004), or through Bayesian time-varying hierarchical multivariate Bayesian models (Bracken et al., 2018).
The climatological variables of Temperatures, CO2, Precipitation, Sea Level, Humidity and Wind Speed have been taken as the aim of study for this work. Figure 1 shows an example of the variation of the variables only in Ecuador. The problem focuses on the construction and estimation of models that perform multivariate identification, taking into account the prediction of the physical variables data. Hence, the aim of this work is to introduce an approximation that increases the accuracy of temperature prediction, based on the data collected through the aforementioned variables in the country of Ecuador.
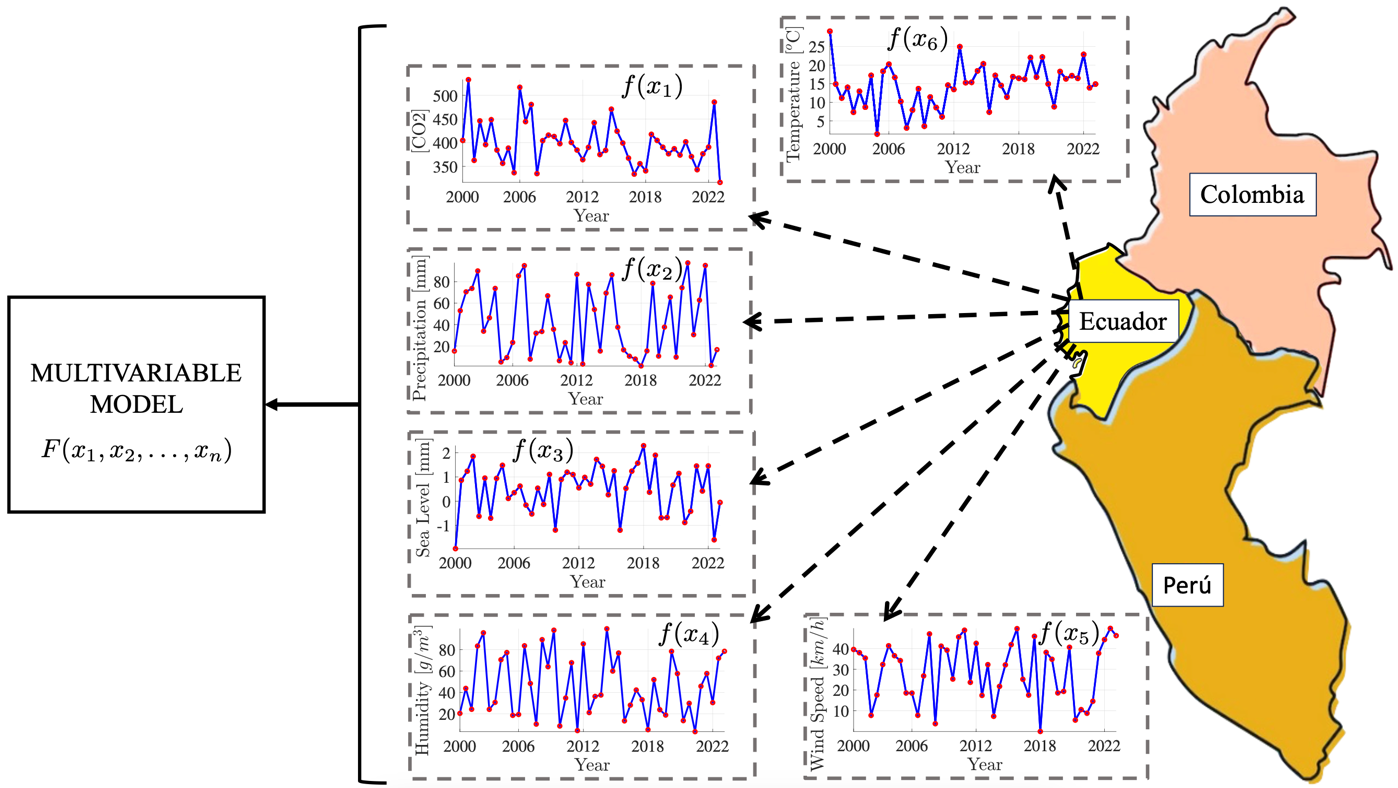
Figure 1. Variation of climatological variables in Ecuador.
The rest of the paper presents: in section 2 a brief description of the multivariate model and the data normalization applied to the problem. Section 3 contains a brief explanation of the experiments and results. Finally, section 4 provides results and discussion, followed by quick conclusions and future work.
2. METHODOLOGY
Due to the fact that the data of the different climatological
variables are aleatory, it is necessary to make an approximation towards models
expressed mathematically and in a unique shape. The definition of these models
facilitates the study and allows the consideration of complex models with
multiple predictors. Thus, assuming that the function in the environment is
differentiable, then, let  and
and  be a differentiable
function k times at the point
be a differentiable
function k times at the point  . Therefore, there
exists a function
. Therefore, there
exists a function  such that:
|
|
(1) |
where,  . Which defines the Taylor
polynomial, which approximates the data of the climatological variables towards
mathematical models.
. Which defines the Taylor
polynomial, which approximates the data of the climatological variables towards
mathematical models.
2.1 MULTIVARIABLE MODEL
Let us assume an input-output model of multivariable systems related as a vector xi, which represents a discrete time series. Then, the state space vector Xi, is constructed as a m-dimensional random vector, which is expressed as:
|
|
(2) |
where, the current time is represented by
 , while,
  ,
,  and
and  describe the state
vector, the vector of inputs and the vector of outputs, where, n, p
and q are the number of states, number of inputs and number of outputs
of the system respectively.
describe the state
vector, the vector of inputs and the vector of outputs, where, n, p
and q are the number of states, number of inputs and number of outputs
of the system respectively.
The objective in each sampling period is to minimize a cost function
J(k)
associated with the error terms between the output y, and the reference, r, in addition to
the control increment,  , such that:
|
|
(3) |

where, Np represents the prediction horizon denoted
by  , while, Nc represents the reference horizon expressed as
  . Finally, Q>=0 and R>0
define the necessary conditions for the minimization of the cost function. Hence,
J(k) is subject to the constraints:
. Finally, Q>=0 and R>0
define the necessary conditions for the minimization of the cost function. Hence,
J(k) is subject to the constraints:
|
|
(4) |
In order to obtain the system outputs, first determine the states at
the sampling instant (k), along the prediction horizon. Next, the future
values of the states![]() , are obtained from
the states estimated in the previous step,
, are obtained from
the states estimated in the previous step, ![]() ,
i.e., by means of a recurrent estimation up to
,
i.e., by means of a recurrent estimation up to ![]() .
Finally, the optimal control sequence,
.
Finally, the optimal control sequence, ![]() , attempting that
the estimated outputs Np reach the references r.
, attempting that
the estimated outputs Np reach the references r.
3. DATA PROCESSING
The purpose of downscaling in climatology and meteorology is to use spatio-temporal data to infer values at finer scales. Statistical downscaling approximates patterns to an existing data set taken from observations or physical models.
Then, in order to perform a statistical analysis, a normal distribution transformation of the data has been carried out. However, the data of the different variables show an asymmetry and an annual periodicity. Therefore, the data of the climatological variables have been normalized and standardized (Olson & Kleiber, 2017), with the aim of transferring the deterministic components, i.e., stationarity and periodicity.
Gaussian distributions can be derived by a
simple transformation of the variables to a standard multivariate normal
distribution. Then, assuming X as the random vector and the cumulative
distribution functions ![]() as the accumulated distribution functions. Hence,
as the accumulated distribution functions. Hence,
![]() possesses uniform
distributions and each component of the random vector can be transformed into a
random variable of standard normal distribution, such that:
possesses uniform
distributions and each component of the random vector can be transformed into a
random variable of standard normal distribution, such that:
|
|
(4) |
This approach
shows a classical multivariate case, which assumes ![]() ,
with j=1, …, m, indicating a multivariate standard normal
distribution
,
with j=1, …, m, indicating a multivariate standard normal
distribution ![]() , with corresponding
probability density function
, with corresponding
probability density function ![]() and covariance
matrix
and covariance
matrix ![]() .
.
4. RESULTS AND DISCUSSION
The presented method achieves predictive performance comparable to that of supervised statistical methods. Thus, in order to perform a numerical and graphical experimentation of the proposed model, it has been taken the data set from the observations made by (Goyal, 2023), where a total of 10,000 records of information from 6 climatological variables around the world have been accumulated.
Specifically, the variables measured and analyzed for this research are, CO2, Precipitaction [mm], Sea Level [mm], Humidity [g/m3], and Wind Speed [km/h], collected between the years 2000 and 2020. Simulation results have been achieved (10 simulations per variable), from the definition of an average temperature between 20oC and 25oC. The analysis has been completed after the determination of 5 predictors, described by means of 3 canonical coefficients per predictor.
Therefore,
considering the uncertainty in the analysis, the data modeling has been
performed by means of a mixture of univariate normal probability distributions.
Thus, the probability density functions of the climatological variables have
been detailed in Table 1. Where, Pearson’s Correlation Coefficient R2,
the coefficient of determination ![]() , the adjusted
Coefficient R2 and the standard error
, the adjusted
Coefficient R2 and the standard error ![]() are shown.
are shown.
Table 1. Estimated climatological relationship coefficients in Ecuador.
|
|
Correlation coefficient R2 |
Determination coefficient |
R2 fit |
Standard error |
|
Ecuador |
0,336678 |
0,113352 |
0,002521 |
5,690707e-3 |
Specifically, the variance in equation (5) and the residual variance in equation (6) are defined as follows
|
|
(5) |
|
|
(6) |
Therefore, the Coefficient of Determination is expressed as:
|
|
(7) |
Consequently, Figure 2 describes a cumulative empirical distribution, which presents an evident heterogeneity, described as the frequency histogram of the approximate model of the climatological variables, where the blue line shows a Gaussian filter and the red line shows the approximation of the model.
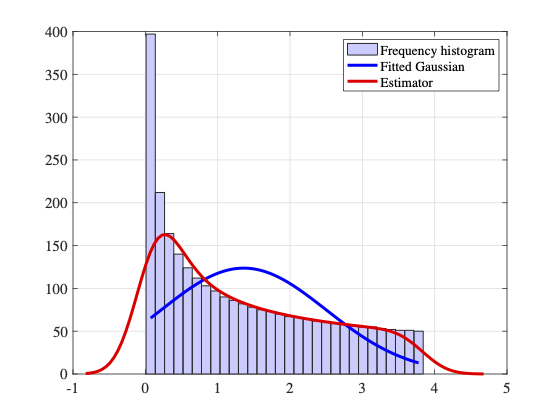
Figure 2. Cumulative Empirical Distribution
On the other hand, from the approximate model, Figure 3 shows the average variation of the climatological variables studied. It can be seen that the average values in each variable, with which a temperature is maintained between 20oC and 25oC, are CO2=375.14926, Precipitaction=70.33778[mm], Sea Level=1.67847[mm] Humidity=69.91908[g/m3], and Wind Speed=46.19514[km/h].
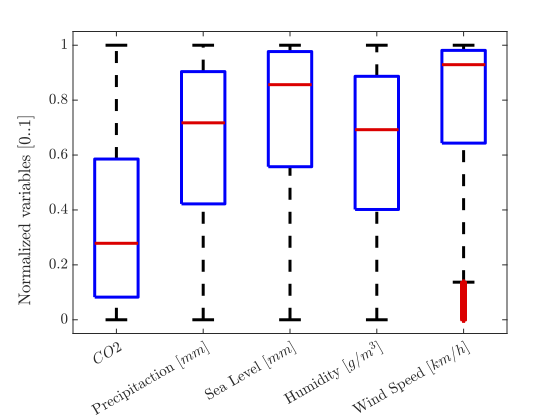
Figure 3. Average values of climatological variables in the approximate model.
CONCLUSIONS
The work presented here performs a prediction test that estimated the real climatological data in Ecuador between the years 2000 and 2020. Since the number of climatological variables data is limited, the nonlinear multivariate statistical analysis is complicated, so a starting point is required to perform an adequate normalization of data.
The approach presented takes into account the correlations observed among the climatological variables, the model is constrained by a normal distribution, and finally, the data are the result of numerous simulations, which suggests that it can be improved. The results show that the nonlinear system is applicable in various nonlinear systems with a large number of variables, which have a certain level of interaction among them.
As future work, it is proposed to perform a multi-objective analysis through a Pareto analysis, which could allow the development of a new approximate climatological prediction model. As well as the comparison of prediction performance in front of dynamic Artificial Neural Network (ANN) structures and recurrent neural networks.
Acknowledgements
Gloria Vanegas y Cecilia Urquizo express gratitude to Instituto Superior Tecnológico Bolivar for the support in the work carried out. Franklin Samaniego thanks the Universidad Nacional de Chimborazo.
Declaration of Conflicting Interests
The authors declared no potential conflicts of interest within this research, authorship, and/or publication of this article.
REFERENCES
Adwan, I., Milad, A., Memon, Z. A., Widyatmoko, I., Zanuri, N. A., Memon, N. A., & Yusoff, N. I. M. (2021). Asphalt pavement temperature prediction models: A review. In Applied Sciences (Switzerland) (Vol. 11, Issue 9). MDPI AG. https://doi.org/10.3390/app11093794
Arnell, N. W., Brown, S., Gosling, S. N., Gottschalk, P., Hinkel, J., Huntingford, C., Lloyd-Hughes, B., Lowe, J. A., Nicholls, R. J., Osborn, T. J., Osborne, T. M., Rose, G. A., Smith, P., Wheeler, T. R., & Zelazowski, P. (2016). The impacts of climate change across the globe: A multi-sectoral assessment. Climatic Change, 134(3), 457–474. https://doi.org/10.1007/s10584-014-1281-2
Arnell, N. W., Lowe, J. A., Challinor, A. J., & Osborn, T. J. (2019). Global and regional impacts of climate change at different levels of global temperature increase. Climatic Change, 155(3), 377–391. https://doi.org/10.1007/s10584-019-02464-z
Barange, Bahri, Beveridge, MCM, Cochrane, KL, Funge-Smith, Poulain, & eds. (2018). Impacts of climate change on fisheries and aquaculture. In United Nations’ Food and Agriculture Organization (Vol. 12, Issue 4, pp. 628–635).
Bracken, C., Holman, K. D., Rajagopalan, B., & Moradkhani, H. (2018). A Bayesian Hierarchical Approach to Multivariate Nonstationary Hydrologic Frequency Analysis. Water Resources Research, 54(1), 243–255. https://doi.org/10.1002/2017WR020403
Busuioc, A., Giorgi, F., Bi, X., & Ionita, M. (2006). Comparison of regional climate model and statistical downscaling simulations of different winter precipitation change scenarios over Romania. Theoretical and Applied Climatology, 86(1–4), 101–123. https://doi.org/10.1007/s00704-005-0210-8
Favre, A. C., Adlouni, S. El, Perreault, L., Thiémonge, N., & Bobée, B. (2004). Multivariate hydrological frequency analysis using copulas. Water Resources Research, 40(1). https://doi.org/10.1029/2003WR002456
Goyal, A. (2023). Exploring the Impact of Climate Change: A Comprehensive Dataset on Temperature. https://www.kaggle.com/datasets/goyaladi/climate-insights-dataset/data
Jin, Y.-H., Kawamura, A., Jinno, K., & Berndtsson, R. (2005). Nonlinear multivariable analysis of SOI and local precipitation and temperature. Nonlinear Processes in Geophysics, 12, 67–74. https://doi.org/https://doi.org/10.5194/npg-12-67-2005
Masson-Delmotte, V., Zhai, P., Pörtner, H. O., Roberts, D., Skea, J., Shukla, P. R., Pirani, A., Moufouma-Okia, W., Péan, C., Pidcock, R., & others. (2018). Global Warming of 1.5◦ C: Special Report. Intergovernmental Panel on Climate Change: Geneva, Switzerland. https://www.ipcc.ch/sr15/
Miao, Y., Zhang, C., Zhang, X., & Zhang, L. (2023). A Multivariable Convolutional Neural Network for Forecasting Synoptic-Scale Sea Surface Temperature Anomalies in the South China Sea. Weather and Forecasting, 38(6), 849–863. https://doi.org/10.1175/WAF-D-22-0094.1
Olson, B., & Kleiber, W. (2017). Approximate Bayesian computation methods for daily spatiotemporal precipitation occurrence simulation. Water Resources Research, 53(4), 3352–3372. https://doi.org/10.1002/2016WR019741
O’Neill, B. C., M Done, J., Gettelman, A., Lawrence, P., Lehner, F., Lamarque, J.-F., Lin, L., J Monaghan, A., Oleson, K., Ren, X., & others. (2018). The benefits of reduced anthropogenic climate change (BRACE): a synthesis. Climatic Change, 146, 287–301. https://doi.org/https://doi.org/10.1007/s10584-017-2009-x
Renard, B., Thyer, M., McInerney, D., Kavetski, D., Leonard, M., & Westra, S. (2022). A Hidden Climate Indices Modeling Framework for Multivariable Space-Time Data. Water Resources Research, 58(1). https://doi.org/10.1029/2021WR030007
Sesana, E., Gagnon, A. S., Ciantelli, C., Cassar, J. A., & Hughes, J. J. (2021). Climate change impacts on cultural heritage: A literature review. In Wiley Interdisciplinary Reviews: Climate Change (Vol. 12, Issue 4). John Wiley and Sons Inc. https://doi.org/10.1002/wcc.710
Solazzo, E., Bianconi, R., Hogrefe, C., Curci, G., Tuccella, P., Alyuz, U., Balzarini, A., Baro, R., Bellasio, R., Bieser, J., Brandt, J., Christensen, J. H., Colette, A., Francis, X., Fraser, A., Garcia Vivanco, M., Jiménez-Guerrero, P., Im, U., Manders, A., … Galmarini, S. (2017). Evaluation and error apportionment of an ensemble of atmospheric chemistry transport modeling systems: Multivariable temporal and spatial breakdown. Atmospheric Chemistry and Physics, 17(4), 3001–3054. https://doi.org/10.5194/acp-17-3001-2017
Tukimat, N. N. A., Harun, S., & Tadza, M. Y. M. (2019). The potential of canonical correlation analysis in multivariable screening of climate model. IOP Conference Series: Earth and Environmental Science, 365(1). https://doi.org/10.1088/1755-1315/365/1/012025
Zscheischler, J., Westra, S., Van Den Hurk, B. J. J. M., Seneviratne, S. I., Ward, P. J., Pitman, A., AghaKouchak, A., Bresch, D. N., Leonard, M., Wahl, T., & others. (2018). Future climate risk from compound events. Nature Climate Change, 8(6), 469–477. https://doi.org/https://doi.org/10.1038/s41558-018-0156-3