1. INTRODUCTION
Over the last decade, the importance of proper water distribution has gained increasing relevance in society, particularly in rural areas where scarcity is more evident due to its dual use in agriculture and human consumption. Consequently, both authorities and the general community have prioritized studies and projects aimed at ensuring the efficient use of water.
The Municipality of Latacunga (2016), in its development and territorial planning framework, identified water scarcity as a priority issue. In the Juan Montalvo Parish, Water Boards are responsible for managing the distribution of water resources. The National Secretariat for Water has implemented a system to legalize these associations, enabling better control over water distribution. However, the lack of regulation in the channel that supplies water to the neighborhoods under study does not ensure proper distribution, often resulting in shortages. Based on this information, it is essential to implement an automated system to optimize the distribution of this resource and mitigate scarcity.
According to Vásquez Martínez et al. (2023), the application of process automation and data management offer numerous benefits. Automating water control and distribution centers are essential to improve the current water supply situation by ensuring efficient distribution and reducing potential leaks and waste. Data obtained from automated water plants enable better control of the various components of the system, from collection to flow regulation.
Currently, projects aimed at efficiently managing water distribution have been developed. For example, Molina et al. (2018) demonstrated in their study in Cuenca, Ecuador, that controlling water consumption, preventing leaks, utilizing water-saving devices, and implementing water reuse systems can achieve up to a 30% reduction in water use without impacting residents’ lifestyles.
Similarly, García Flores (2020) highlighted the importance of measuring and controlling water flow in the highlands of Azogues Canton. This precise control allows for better evaluation of consumption and facilitates the identification and reduction of water losses.
Andrade Falcones et al. (2019), in their study on redesigning potable water supply systems following technical design standards, showed that it is possible to improve both the quality and efficiency of water supply in the San Vicente de Andoas community, part of Pedro Vicente Maldonado Canton in Pichincha Province.
Additionally, Maldonado et al. (2018) demonstrated that implementing a system to measure the instantaneous flow of the Pumamaqui irrigation channel in Cayambe Canton, using a Parshall flume and an ultrasonic sensor, allowed for effective monitoring of water distribution to various agricultural and livestock sectors. This optimization directly benefited the community's residents.
Proper management of water resources not only prevents economic losses but also helps conserve this vital resource. Efficient distribution promotes savings, sustainable consumption, and improved service for consumers. Several studies have emphasized the importance of monitoring and controlling water losses while redistributing it effectively. Ramírez et al. (2016), in their research on open-channel flow measurement and promoting irrigation service delivery by volume, demonstrated the significance of water flow measurement for efficient resource management.
Bartolín (2013) highlighted the role of sectorization in the technical management of water distribution networks, including aspects such as fault management, demand control, and leak detection. Using the potential of vector-based Geographic Information Systems (GIS), they developed mathematical models of distribution networks that supported municipalities in optimizing their tasks. Similarly, Inga (2019) applied sectorization in Huacho, Peru, showing that this approach enabled efficient water flow redistribution, reducing both water losses and economic losses.
Based on the presented evidence, it is recommended to implement a flow control system to optimize water distribution, considering both the available flow and the number of households in the affected neighborhoods. The objective is to establish a control system (Andrade Cedeño, 2019) that ensures proper water distribution and prevents shortages by installing an automated system to measure and control flow. The proposal includes installing a flow transmitter (Parshall flume + ultrasonic transmitter) (CLIMATIQUES, 2019) at the entry points of distribution channels to measure the flow directed to the neighborhoods. Additionally, flow control valves (Castaño Giraldo, 2018) are suggested for the channel outlets. The opening percentage of these valves will depend on the available water flow and the number of residents in each neighborhood.
The main contribution of this work lies in its ability to optimize water distribution based on the number of residents in each neighborhood, offering a viable solution to ensure a consistent water supply and prevent shortages. This innovative approach stands out for its adaptability, guaranteeing equitable water distribution in all neighborhoods. By replacing manual gates (currently installed) with control valves, precise regulation of opening and closing is achieved, preventing manipulation for the Benefit of a single neighborhood (as currently occurs). While previous studies have primarily focused on monitoring water flow during the collection stage, this research emphasizes the importance of monitoring and controlling flow during the distribution stage, considering the population size of each area or neighborhood.
2. MATERIALS AND METHODOLOGY
The methodology of this research is correlational and quantitative in nature, allowing for a systematic evaluation of the proposed system. The methodology was structured into various stages, ranging from data collection to system simulation and the evaluation of the obtained results. A flowchart was utilized to illustrate these stages (as shown in Figure 1).
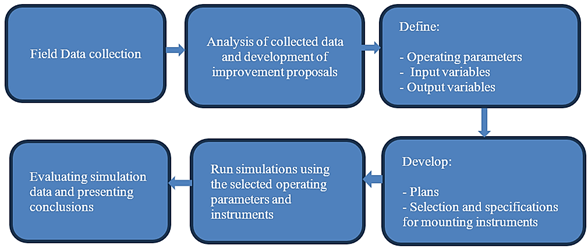
Figure 1. Flowchart for development of proposed control system.
According to Figure 1, the first stage involved a field survey, which enabled the collection of data on the population residing in each neighborhood under study, as well as the water collection and distribution facilities and the identification of water distribution boxes for each neighborhood.
In the second stage, the data collected during the field survey were analyzed, and a proposal was prepared to improve the existing facilities.
During the third stage, the operating parameters and the input and output variables of the proposed control system were defined. Subsequently, in the fourth stage, calculations were conducted to determine the water requirements for each neighborhood. Additionally, the most suitable measurement instruments, control devices, and programmable logic controller were selected to ensure the optimal operation of the proposed system, in conjunction with the water intake and distribution facilities. Plans were also developed, and the actions of the instruments installed at the system’s input and output were specified.
In stages five and six, the simulation of control and monitoring systems (Cottengim et al., 2019) were carried out, and the results were analyzed and presented.
2.1. Field Data collection
The field data collection was carried out at the Illuchi No. 1 hydroelectric plant, located in the province of Cotopaxi, Latacunga canton, Juan Montalvo parish. The discharge from these turbines flows into a canal that serves as the water collection for the neighborhoods of Pusuchisi, Pichalo, Pangiua Chico, and Pangiua Grande.
The water collection canal is open, and next to it are distribution boxes equipped with manually operated gates at their outlets. During drought periods, the water flow decreases significantly, further exacerbating the scarcity issue. Due to the lack of proper control, these gates can be mismanaged, potentially leading to water shortages in some neighborhoods.
Optimal distribution of water flow, based on the population size of each neighborhood, requires calculating the Maximum Daily Flow, analyzing the current distribution system infrastructure, determining the number of residents in each neighborhood, and evaluating the canal dimensions and the diameter of the installed pipes. These factors directly impact the design of the proposed water flow control system. An adequate design will ensure a constant water supply to all neighborhoods.
The population data for the neighborhoods under study were obtained from the local water consumption boards: Pangiua Chico has 250 inhabitants, Pangiua Grande 400 inhabitants, Pichalo 1,450 inhabitants, and Pusuchisi 1,450 inhabitants.
The collected data, along with the selected control system and precisely calibrated instruments (Hendrick, 2019), ensure the efficient operation of the proposed system.
2.2. Proposed Control System
To improve the existing infrastructure and optimize water distribution based on the population size of each neighborhood, the following monitoring and control components were selected:
· 1 Parshall Flume (Sensor): Made of fiberglass-reinforced polyester (corrosion-resistant), ideal for this application. Measurement range: 2.5–245 L/s, control section width: 0.229 m (standard size), adaptable to existing installations (CLIMATIQUES, 2019).
· 1 Flow Meter: Ultrasonic level transmitter, FMU40 sensor, output: 4–20 mA with HART protocol (Endress + Hauser, 2024).
· 4 Flow Control Valves (Final Control Element): Globe valve, 4” diameter, integrated actuator (4–20 mA), pneumatic actuator supply (3–15 PSI) (Rivas, 2017).
· 1 PLC (Programmable Logic Controller): 1756-L74 RS-Logix with an analog input module 1756-IF8H and a digital output module 1756-IF8H, powered by 24V DC.
System Input is formed by:
· The Parshall Flume, as the primary measurement element, ensures recommended flow conditions in the intake channel, enabling precise measurement of the incoming flow
· An ultrasonic level transmitter (Endress + Hauser, 2023) measures and indicates the flow rate at the intake channel.
· A PLC executes the programmed control logic, regulating valve openings based on the flow rate at the system's input.
The output consists of 4 flow control valves (Fisher, 2021), one for each neighborhood: Pusuchisi, Pichalo, Pangiua Grande, and Pangiua Chico. These valves ensure accurate distribution of water to each area.
2.3. Operating parameters
To optimize the proper distribution of water, it is essential to determine the total maximum daily flow (Secretaría del Agua, 2014). Table 1, column 1, presents the maximum daily flows per neighborhood obtained for the study.
Table 1. Maximum Daily Flow (QMD) and Maximum Hourly Flow (QMH) per Neighborhood
|
QMD (l/s) |
QMH (l/s) |
Neighborhood |
|
0.33 |
0.78 |
Pangiua chico (Neighborhood A) |
|
1.52 |
1.25 |
Pangiua grande (Neighborhood B) |
|
1.89 |
4.53 |
Pichalo (Neighborhood C) |
|
1.89 |
4.53 |
Pusuchisi (Neighborhood D) |
Source: De La Cruz (2024)
For the study, the total maximum daily flow (Q) calculated is 4.63 L/s, which represents the minimum flow required at the process inlet. The design flow, determined according to the Secretariat for Water (2014), is 5.57 L/s. The installation is located at an altitude of 3,350 meters above sea level (m.a.s.l.). To calculate the percentage of opening for each valve, the maximum hourly flow was determined according to the methodology of the Secretariat for Water (2014) (refer to Table 1, column 2).
The distribution network analyzed in this study is an open network (Inga Ferreyra, 2019). The parameters used for the network simulation are shown in Table 2.
Table 2. Parameters of the Water Distribution Network
|
Parameter |
Neighborhood A |
Neighborhood B |
Neighborhood C |
Neighborhood D |
|
Demand (L/s) |
0.33 |
1.52 |
1.89 |
1.89 |
|
Elevation (m) |
3340 |
3340 |
3340 |
3340 |
|
Pipe Absolute Roughness (mm) |
120 |
120 |
120 |
120 |
|
Pipe Diameter (mm) |
110 |
110 |
110 |
110 |
|
Pipe Length (mm) |
1000 |
1000 |
1000 |
1000 |
Source: De La Cruz (2024)
2.4. Plans and Instrument Selection
For the simulation of the process, it was necessary to select a primary measuring element. In this case, the Parshal flume was selected, used to measure the water flow in an open channel, the dimensions are defined by the width of the control section (as shown in Figure 2).
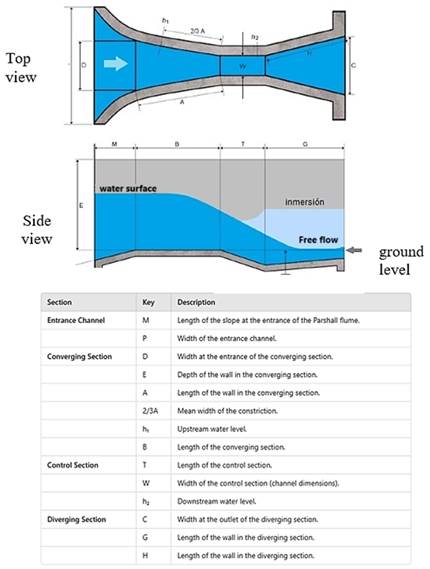
Figure 2. Physical characteristics of a Parshall flume (CLIMATIQUES, 2019)
The dimensions selected for the Parshall flume are: inlet channel width (P) 1.08 m according to Table 3 CLIMATIQUES, 2019).
Table 3. Standard Parshall Flume Dimensions (extract)
|
W (m) |
A (m) |
2/3 A |
B (m) |
D (m) |
P (m) |
T (m) |
|
0.0254 |
0.363 |
0.242 |
0.356 |
0.167 |
|
0.0762 |
|
0.0508 |
0.414 |
0.276 |
0.406 |
0.214 |
|
0.114 |
|
0.0762 |
0.467 |
0.311 |
0.457 |
0.259 |
|
0.152 |
|
0.152 |
0.621 |
0.414 |
0.610 |
0.397 |
0.305 |
0.305 |
|
0.229 |
0.879 |
0.587 |
0.864 |
0.575 |
0.305 |
0.305 |
|
0.305 |
1.37 |
0.914 |
1.34 |
0.845 |
0.381 |
0.610 |
|
0.457 |
1.45 |
0.965 |
1.42 |
1.03 |
0.381 |
0.610 |
|
0.610 |
1.52 |
1.02 |
1.50 |
1.21 |
0.381 |
0.610 |
|
0.914 |
1.68 |
1.12 |
1.64 |
1.57 |
0.381 |
0.610 |
|
1.22 |
1.83 |
1.22 |
1.79 |
1.94 |
0.457 |
0.610 |
|
1.52 |
1.98 |
1.32 |
1.94 |
2.30 |
0.457 |
0.610 |
|
1.83 |
2.13 |
1.42 |
2.09 |
2.67 |
0.457 |
0.610 |
|
2.13 |
2.29 |
1.52 |
2.24 |
3.03 |
0.457 |
0.610 |
|
2.44 |
2.44 |
1.63 |
2.39 |
3.40 |
0.457 |
0.610 |
|
3.05 |
|
1.83 |
4.27 |
4.76 |
|
0.914 |
Source: (CLIMATIQUES, 2019)
For direct, continuous measurement and recording of flow in the intake channel (open surfaces), an ultrasonic flow transmitter (Endress Hauser, 2023) was selected, as it is highly recommended for open channel flow measurement (CLIMATIQUES, 2019). Based on its measurement principle, the transmitter must be installed as shown in Figure 3. It is essential to maintain the blocking distance (BD = 0.25 m) and ensure the sensor is aligned parallel to the water surface. To obtain the required reading, the transmitter must be configured with the linearization curve (Q/h curve) "Flow to Level."
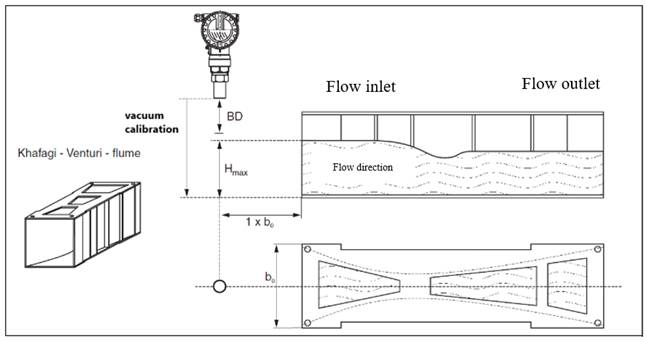
Figure 3. Ultrasonic transmitter installation (Endress Hauser, 2023).
For the system's output, corresponding to the final control element, 4" globe-type flow control valves with integrated actuators (4-20 mA) (Fisher, 2021) and configured as normally open (N.O) (Windhorst, 2012) were selected. In the event of an electrical or pneumatic failure, these valves fully open, allowing the flow of water and ensuring continuous supply to the populations.
For this study, the Allen Bradley ControlLogix programmable logic controller, model 1756-L74 RS-Logix (Rockwell Automation, ControlLogix System User Manual, Publication 1756-UM001P-EN-E, 2017), was chosen. This selection is based on its ability to handle complex industrial applications, scalability, reliability, and ease of integration with other systems. These features ensure efficient control and provide a flexible, robust solution capable of meeting the current and future needs of the water distribution system.
The system also includes an analog input module, 1756-IF8H, designed to receive readings from the level transmitter, and an analog output module, 1756-OF8H, intended to send signals to the control valves (Rockwell Automation, ControlLogix I/O Module Specifications, Publication 1756-TD002R-EN-E, 2024).
3. RESULTS AND DISCUSSION
3.1. Simulation in EPANET (Rossman et al. 2020)
Considering the parameters in Table 3, the open water distribution network was simulated in the EPANET software (Idrobo Oleas, 2018) (as a shown Figure 4).
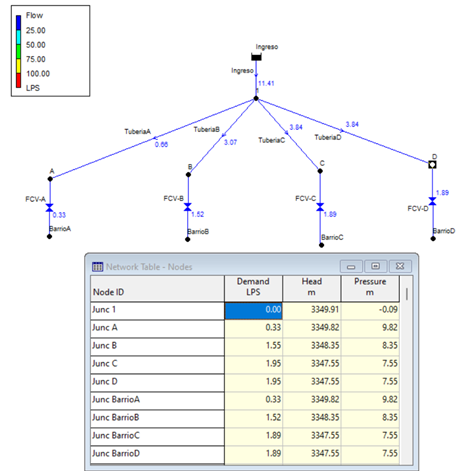
Figure 4. Distribution network of the proposed system (Open network).
Figure 4 shows the flow rate required at the outlet of each valve required for each of the neighborhoods, as indicated in Table 2.
SCADA System Simulation (Perez - Lopez, 2015)
Considering the operating parameters, the data was entered, a system was simulated (Quishpe Estrada, 2017) where the flow indicator transmitter (FIT-001) and the control valves are shown (see Figure 5).
![]()
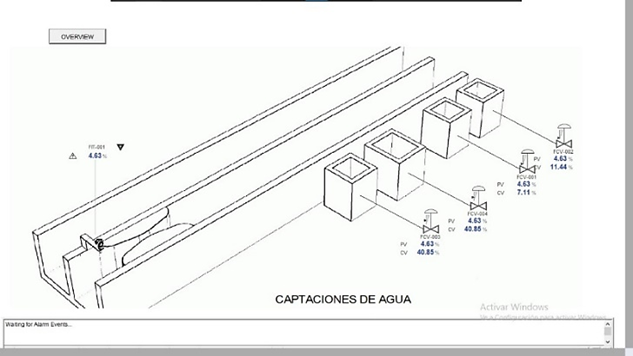
Figure 5. SCADA (Supervisory Control and Data Acquisition) implemented.
Table 4. Percentage of control valve openings.
|
FIT (l/s) |
FCV-A (%) |
FCV-B (%) |
FCV-C (%) |
FCV-D (%) |
|
0 |
0 |
0 |
0 |
0 |
|
1 |
7 |
7 |
7 |
7 |
|
2 |
7 |
7 |
16.3 |
16.3 |
|
3 |
7 |
7 |
25.6 |
25.6 |
|
4 |
7 |
9 |
34.9 |
34.9 |
|
4.63 |
7.1 |
11.3 |
40.8 |
40.8 |
|
5 |
12.5 |
16.5 |
44.2 |
44.2 |
|
6 |
27.1 |
30.4 |
53.5 |
53.5 |
|
7 |
41.7 |
44.3 |
62.8 |
62.8 |
|
8 |
56.2 |
58.2 |
72.1 |
72.1 |
|
9 |
70.8 |
72.2 |
81.4 |
81.4 |
|
10 |
85.4 |
86.1 |
90.7 |
90.7 |
|
11 |
100 |
100 |
100 |
100 |
Source: De La Cruz (2024)
The percentage of valve opening required to ensure the maximum daily flow in the intake channel is detailed in row 6 of Table 4. To regulate this percentage, a PID control module was used (Monsen, 2023). To begin the PID tuning process from a safe and stable state, low values were set for the proportional constant (Kp): 0.5 for FCV-A, 0.5 for FCV-B, and 2 for FCV-C and FCV-D. The integral constant (Ki) and derivative constant (Kd) were initially set to 0. The final adjusted values of the constants, obtained after achieving the desired system response, are presented in Table 5.
Table 5. Constants entered (Dehner, 2017) in the PID control module
|
Válvula |
Kp |
Ki |
Kd |
|
FCV-A |
0.87 |
0.2 |
0.5 |
|
FCV-B |
1.4 |
0.2 |
0.4 |
|
FCV-C |
5 |
0.2 |
0.75 |
|
FCV-D |
5 |
0.2 |
0.75 |
Source: De La Cruz (2024)
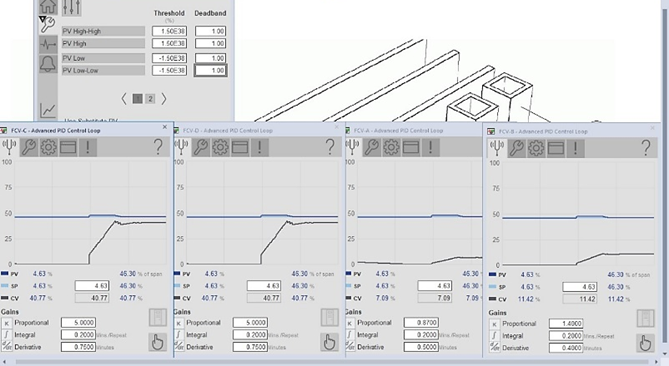
Figure 6. Constants entered into the PID control module and tuning curves.
Figure 6 shows the output curve of the PID control applied to valve regulation. It is observed that, after proper tuning, the proportional gain (Kp) enabled a quick system response, while the integral gain (Ki) helped reduce steady-state error. Additionally, the derivative gain (Kd) improved system stability by minimizing oscillations. As a result, the system responds effectively to changes without causing instability, as illustrated in Figure 6.
3.2. Discussion
The automation of the water distribution system is viable due to the implementation of advanced technologies such as transmitters, control valves, and real-time control systems, which ensure efficient and sustainable operation.
In the simulation (see Figure 5), it is demonstrated that the implemented control system regulates the valves based on the inlet flow rate and the number of residents in each neighborhood, achieving equitable water distribution. According to Figure 6, when the flow rate in the intake channel reaches the minimum required of 4.63 L/s, the valves maintain openings of 7.1% for Pangiua Chico, 11.3% for Pangiua Grande, and 40.8% for Pusuchisi and Pichalo. These settings ensure adequate and equitable supply even when the flow rate is below the design flow. If the inlet flow exceeds the design flow, the valves increase their opening percentage to provide a greater volume of water, adjusting to the population of each neighborhood.
The proposed system is designed to meet the potable water needs of residents, in compliance with the design standards for water supply (Secretaría del Agua, 2014). Furthermore, it can adapt to population growth or infrastructure expansion, maintaining its effectiveness, efficiency, and sustainability in response to changing operational, climatic, and technological conditions.
The system's efficiency also depends on the downstream installations of the control valves. Previous studies (Bartolín Ayala, 2013; Inga Ferreyra, 2019) have shown that proper installation of pipelines at both household and municipal levels significantly reduces water losses.
A limitation of the system's effectiveness is the nature of the network, which, being open, does not allow for water recirculation, leading to waste. Additionally, the lack of monitoring along the pipeline prevents verification of the flow reaching the main distribution networks in each neighborhood, which can affect supply efficiency.
Therefore, it is recommended to implement a monitoring system in the main distribution networks in the future to ensure equitable distribution and minimize water losses. It is also suggested to install wireless flow meters in each household to obtain real-time data and apply corrective measures in cases of high consumption, which may indicate pipeline leaks.
Another challenge is the lack of control downstream of the distribution boxes, as water continues its path through the intake channel and discharges into the river. A potential solution would be the installation of a gate controlled by a motorized valve, allowing partial closure to maintain the inlet flow equal to or greater than the minimum required, thereby ensuring water supply to the neighborhoods.
CONCLUSIONS
Through the development, design, and simulation of the automated water distribution system, the ability to regulate water flow based on the number of residents was demonstrated using control valves, ensuring that each neighborhood receives the required flow in compliance with design standards for potable water supply.
The research confirms that this is a viable and efficient solution to guarantee equitable access to water for the neighborhoods under study. It concludes that controlling flow through the valves is essential to achieving optimal water distribution. The selected monitoring and control system has proven to be suitable and precise, enabling equitable distribution of water resources to each resident.
The innovative approach of this study stands out for its adaptability to various intake and distribution systems, its scalability, and its flexibility, as well as its ability to effectively respond to changes in demand, climatic conditions, and system failures. The proposed design ensures equitable water distribution by replacing the manual gates of the current installation with control valves, achieving precise regulation of opening and closing. This not only improves the system's efficiency but also prevents manipulation that could unfairly benefit a single neighborhood, as observed in the current situation.
Declaration of Conflict of Interest
The authors declare that there are no potential conflicts of interest within this research, authorship and/or publication of this article.
REFERENCIAS
Andrade Cedeño, R. (2019). Módulo didáctico para controlar nivel y caudal de agua, mediante sistema SCADA, PLC y algoritmo PID. RIEMAT Revista de Investigaciones en Energía, Medio Ambiente y Tecnología, 4(2), 50-62. https://doi.org/10.33936/riemat.v4i2.2196
Andrade Falcones, C. F., & Colcha Valdez, J. (2019). Rediseño de la obra de captación, línea de conducción, reservorio y planta de tratamiento para el sistema de agua potable de la Comunidad San Vicente de Andoas, cantón Pedro Vicente Maldonado, provincia de Pichincha [Tesis de grado, Universidad Politécnica Salesiana]. Repositorio Institucional., Quito. http://dspace.ups.edu.ec/handle/123456789/19996
Bartolín Ayala, D. F. (2013). Confección de modelos de redes de distribución de agua desde un SIG y desarrollo de herramientas de apoyo a la toma de decisiones [Tesis doctoral, Universidad Politécnica de Valencia]. Repositorio Institucional. Valencia. http://hdl.handle.net/10251/33152
Castaño Giraldo, S. (2018). Válvula de Control – Elemento Final de Control. Control Automático Educación: https://controlautomaticoeducacion.com/instrumentacion/valvula-de-control/
CLIMATIQUES, M. D. (2019). Sampling Guide for Environmental Analysis: Book 3 – Flow Measurement Methods. Québec: Centre d’expertise en analyse environnementale du Québec. http://www.ceaeq.gouv.qc.ca/documents/publications/echantillonnage/debit_conduit_ouvC7.pdf
Cottengim, A., Nguyen, D., Gilman, J., & Reynolds, T. (2019). Online water quality and control system. InTech a publication of the International Society of Automation, 66(1), 36-40. https://www.isa.org/intech-home/2019/january-february/features/online-water-quality-and-control-system
Dehner, B. (2017). Optimizing to the tune of a PID equation. InTech a publication of the International Society of Automation. https://www.isa.org/intech-home/2017/may-june/features/optimizing-to-the-tune-of-a-pid-equation
Endress Hauser. (2024). Medición continua de nivel en líquidos y sólidos con sensores de nivel ultrasónicos. Endress Hauser México: https://www.mx.endress.com/es/instrumentacion-campo/medicion-nivel/medicion-nivel-ultrasonidos-sin-contacto
Endress Hauser. (2023). Información técnica Prosonic M FMU40/41/42/43/44 Medición de nivel ultrasónica. Endress Hauser. https://bdih-download.endress.com/files/DLA/47A881B973E301A7E10000000A35E035/TI365Fes_v04.07.pdf
Fisher. (2021). Sistema de válvulas de control y actuador GX de Fisher™. Emerson. https://www.emerson.com/documents/automation/sistema-de-v%C3%A1lvula-de-control-y-actuador-gx-de-fisher-fisher-gx-control-valve-actuator-system-spanish-universal-es-134982.pdf
García Flores, J. C. (2020). Diseño de una metodología para control de pérdidas de agua potable para la zona alta del cantón Azoguez. Dominio de las Ciencias, 6(4), 452-470. https://dialnet.unirioja.es/servlet/articulo?codigo=8638140
Hendrick, N. (2019). InTech a publication of the International Society of Automation. Setting up an instrument calibration plan, 66(4), 38-40. https://www.isa.org/intech-home/2019/july-august/departments/setting-up-an-instrument-calibration-plan
Idrobo Oleas, P. A. (2018). Desarrollo de un modelo de simulación mediante el software Epanet de la red de distribución de agua potable de la cabecera cantonal de Guano, provincia de Chimborazo [Tesis de grado, Universidad Superior Politécnica de Chimborazo ]. Repositorio Institucional, Guano, Chimborazo, Ecuador. http://dspace.espoch.edu.ec/handle/123456789/9664
Inga Ferreyra, A. N. (2019). Redistribución del caudal, reducción de pérdidas de agua y aumento de la ganancia económica por el agua no facturada a través de una nueva sectorización para mejorar la prestación del servicio de agua potable en el Distrito de Huacho [Trabajo de grado, Universidad Nacional José Faustino Sanchez Carrión]. Repositorio Institucional., Huacho. https://repositorio.unjfsc.edu.pe/handle/20.500.14067/2758
Maldonado Ferrín, P. D., & Román Aldás, D. J. (2018). Desarrollo de un transductor para la medición de caudal en un aforador tipo Parshall en la acequia Pumamaqui de la cuenca del río Pisque [Tesis de grado, Universidad Politécnica Salesiana ]. Repositorio Institucional, Cayambe. https://dspace.ups.edu.ec/handle/123456789/15589
Molina, E., Quesada, F., Calle, A., Ortiz, J., & Orellana, D. (2018). Consumo sustentable de agua en viviendas de la ciudad de Cuenca. Ingenius Revista de Ciencia y Tecnología, 20(No. 20 (2018): july-december), 28-38. https://ingenius.ups.edu.ec/index.php/ingenius/article/view/20.2018.03
Monsen, J. (2023). Fundamentals of PID Control. InTech Official publication of the International Society of Automation, 70(3), 12-21. https://www.isa.org/intech-home/2023/june-2023/features/fundamentals-pid-control
Municipio de Latacunga. (2016). Plan de desarrollo y ordenamiento territorial 2016-2028.
Perez - Lopez, E. (2015). Los sistemas SCADA en la automatización industrial. Revista Tecnología en Marcha, 28(4), 3-14. https://www.scielo.sa.cr/scielo.php?pid=S0379-39822015000400003&script=sci_abstract&tlng=es
Quishpe Estrada, F. d. (2017). Diseño de un prototipo de sistemas SCADA para el monitoreo de captación, almacenamiento y distribución de agua potable para la EP-EMAPAR [ Trabajo de grado, Escuela Superior Politécnica de Chimborazo ]. Repositorio Institucional, Riobamba. http://dspace.espoch.edu.ec/handle/123456789/7337
Ramírez Luna, J. J., Carrasco Dehesa, U., & Camacho Peral, P. (2016). Medición de flujo de agua. Instituto Mexicano de Tecnología del agua. http://repositorio.imta.mx/handle/20.500.12013/2191?locale-attribute=en
Rivas, J. (2017, Octubre 27). ISA Sección Española. Elección de válvulas de control: https://isa-spain.org/eleccion-de-valvulas-de-control-1a-parte/
Rockwell Automation. (2017). Manual de usuario Sistema ControlLogix, Rockwell Automation Publication 1756-UM001P-ES-P.
Rockwell Automation. (2024). Especificaciones de módulos I/O ControlLogix, Rockwell Automation 1756-TD002R-EN-E. Rockwell Automation.
Rossman, K., Woo, H., Tryby, M., Shang, F., Janke, R., & Haxton, T. (2020). Manual del usuario de EPANET 2.2. EPA United States Environmental Protection Agency. https://www.epa.gov/system/files/documents/2021-07/epanet_users_manual_2.2.0-1.pdf
Secretaría del Agua. (2014). Norma CO 10.7 - 602 - Revisión. Norma de diseño para sistemas de abastecimiento de agua potable, disposición de excretas y residuos líquidos en el área rural. Secretaría del Agua.
Vásquez Martínez, M., Hernández Cadena, A., Jesús Magaña, J., Gómez Zea, J., & Garrido Vásquez, J. (2023). Beneficios de implementar la automatización en la industrialización de procesos. Innovación y desarrollo tecnológico revista digital, 15(3), 7. https://iydt.wordpress.com/wp-content/uploads/2023/07/3_24_beneficios-de-implementar-la-automatizacion1.pdf
Windhorst, J. (2012). The Importance of Correct Control Valve Fail-safe Mode Documentation in Avoiding Process Incidents. Procedia Engineering, 45, 880-887. https://doi.org/10.1016/j.proeng.2012.08.253