1. INTRODUCTION
Pyrolysis is a thermochemical reprocessing process that involves heating plastics to high temperatures in the absence of oxygen, allowing their decomposition into simpler compounds (Angulo & Carrera, 2023). By delving deeper into the mechanisms involved in pyrolysis and conducting a thorough characterization of the obtained products, the aim is to refine and optimize this technique to produce more efficient and higher-quality fuels (Marimon, 2022).
The generation of fuels from the pyrolysis of polystyrene is being developed in a context of growing concern about the environmental impacts of plastics, driving the active search for innovative technological solutions. Pyrolysis is considered a potential option to convert plastic waste, such as polystyrene, into useful products like fuel. However, despite its great potential, the comprehensive characterization of fuels generated by this process remains an understudied but essential area to evaluate the viability and sustainability of technology (Kwakwa & Alfonso, 2021).
Ecuador faces a significant challenge in managing plastic waste, particularly single-use plastics. Managing this waste has become an urgent necessity (Ortega et al., 2020) due to its slow degradation and the severe environmental impacts it causes, such as air and water pollution (Espinoza, 2022). In this context, the pyrolysis of polystyrene has emerged as a potential alternative to address this problem, offering the possibility of converting plastic into useful fuels and contributing at the national level (Castro et al., 2024). This approach aims to transform plastic waste into value-added products, significantly reducing its environmental impact and promoting more sustainable resource management (Machado et al., 2015).
The study aimed to characterize the fuel extraction process via pyrolysis to identify the optimal temperature and duration conditions required to maximize liquid fuel production (Miandadd, 2017). The resulting fuel may have a chemical composition different from conventional fuel, making it necessary to conduct tests to evaluate its stability. These tests may include engine performance analysis, emissions analysis, and compatibility with current fuel systems (Pinargote & Sánchez, 2023).
1.1. Factors that influence the pyrolysis of plastics.
The efficiency of plastic pyrolysis is determined by several essential factors that affect the yield and quality of the obtained products. These factors include:
Influence of Temperature: Maintaining an appropriate temperature is critical to initiating and sustaining the thermal decomposition of polymers. Studies indicate that high temperatures can accelerate the decomposition process and favor the production of gaseous and liquid products with higher energy yield (Nuñez, 2019). However, at very high levels, undesired byproducts such as dioxins and furans may be generated (Mohamed, 2017).
Importance of Residence Time: Residence time determines the duration for which the input material remains in the reactor. A longer residence period can facilitate a more complete decomposition of the polymers and improve the generation of products of interest (Salinas & Vázquez, 2010).
Impact of Pressure: Changes in pressure can influence product distribution and the rate of chemical reactions. Research shows that higher pressures can increase the production of gases and liquids, while lower pressures favor the formation of solid carbon products (Rojas, 2012).
Composition of Feedstock Material: The type of plastic used in the pyrolysis process is another determining factor. Different polymers have thermal and chemical properties that affect their decomposition rate and the quality of the final products. Heterogeneous plastic mixtures may require adjustments in operating conditions to maximize yield and minimize unwanted byproducts.
1.2. Chemical and physical properties of Commercial Diesel
API Gravity: The specific gravity scale developed by the American Petroleum Institute (API). This scale measures the relative density of different petroleum-derived liquids, expressed in degrees. In general, crude oil has an API gravity between 30 and 40 degrees, with variations depending on its specific composition and the refining process it has undergone (Maprin, 2022).
Specific Gravity: The ratio between the absolute density of a substance and that of a reference standard, which is water for liquids and air for gases. The density of petroleum, also known as crude oil or naphtha, ranges between 0.79 and 0.88 at a temperature of 15.6°C (59°F), indicating it is less dense than water, which has a density of 1000 kg/m³.
PSW (Water and Sediment Content): This parameter is critical for evaluating fuel quality because it indicates the number of impurities, such as sediments and water, present in the fuel. During production, transportation, and storage, fuels can contain small amounts of water. Excessive water can cause various problems.
ASTM Diesel Distillation: This parameter is crucial for assessing fuel quality, as it indicates the levels of impurities, such as sediments and water, present in the fuel. Fuels may accumulate small amounts of water during production, transportation, and storage, and excessive amounts can lead to various issues.
Flash Point: The minimum temperature at which a flammable mixture can form when interacting with air. The Pensky-Martens apparatus is used to determine this value. A flammable substance is one that undergoes changes when in contact with fire or combustion. For diesel, the flash point range is between 52°C and 96°C (INSST, 2018).
Kinematic Viscosity: Secondary reference materials, such as fuel oil No. 6 and diesel, were used with viscosities ranging from 347.0 to 869.5 mm²/s and colors between 0.5 and 7.9 units. Precision parameters and uncertainty were evaluated and analyzed. Certified reference materials (N600) were used to verify accuracy.
Sulfur Content: To meet the demand for premium oil in Ecuador, the Esmeraldas refinery produced this type of oil with an average sulfur content of 44 ppm in February 2022, representing about 35% of the national supply of hydrocarbons (EP PETROECUADOR, 2022).
ASTM Color: This system, known as the "mineral oil color value," classifies petroleum-derived products. During the refining process, the color of mineral oils is continuously monitored to ensure they are refined to the appropriate level. Additionally, it helps ensure proper fuel use for its intended purpose and prevents contamination and quality degradation (Hernández, 2009).
Calorific Value: In diesel engines, 7% to 10% biodiesel is used. This is added to diesel to reduce soot production during combustion and improve the calorific value. The higher the temperature in the combustion chamber, the more fuel can be burned, reducing the effort required to move the piston and connecting rod within the engine. The lower calorific value of biodiesel is 35.86 MJ, although it can vary depending on its composition (RACE, 2022).
2. MATERIALS AND METHODS
An exploratory study was conducted to analyze the chemical and physical properties of fuel derived from plastic pyrolysis. Using a qualitative and quantitative approach, a laboratory analysis was carried out to identify its properties and potential applications.
2.1. Acquisition of raw material
For the pyrolysis sampling, 1 kg of granulated polystyrene is weighed and placed into the reactor, after which the flange is securely closed. Water is then introduced into the condenser, maintaining a temperature of 1 to 3°C. Over approximately 6 to 7 minutes, polymerization reactions occur within the reactor, as illustrated in Figure 1. At the end of the process, the pyrolysis product is collected in a 1L container, which is subsequently transported to the laboratory for critical analysis.
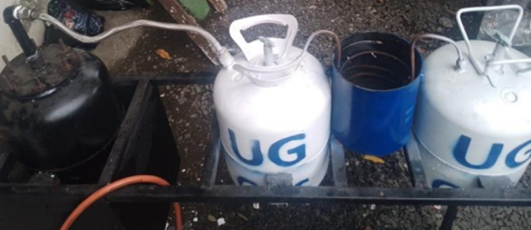
Figure 1. Preparation for Pyrolysis. Source: The Authors (2024)
.
2.2. Laboratory characterization test
Once the liquid sample was obtained through the pyrolysis process, various characterization tests were conducted in the laboratory using 1 liter of the sample. These tests were designed to analyze key properties of the generated fuel and assess its potential applicability. The methods used are described below:
API Gravity
The API gravity was measured using a 1-liter graduated cylinder filled with the liquid sample. A hydrometer was used to record the corresponding value after stabilization, and the result was then adjusted to the reference temperature using standard tables. The final value was calculated based on these adjustments to ensure consistency with petroleum measurement standards.
Specific Gravity
The specific gravity was calculated using the standard formula based on API degrees, providing a precise value under controlled conditions. The calculation was performed using the following equation:
![]() (1)
(1)
Where:
API: Degrees API 15,6 °C
SG: Specific gravity
Water and sediment Content (PSW)
The water and sediment content were determined following the NTE INEN 1494 standard. A 50 ml sample and 50 ml of solvent were prepared in two centrifuge tubes, ensuring that both tubes had equal volumes. The tubes were then sealed with stoppers and mixed thoroughly. They were placed in a centrifuge set at 140°F (60°C) for 15 minutes at 1300 rpm.
ASTM Distillation
To perform the distillation of the pyrolytic liquid derived from polystyrene, 1 liter of the sample was introduced into the distillation flask (Figure 2). As the temperature increased, the distilled liquid was collected in a graduated cylinder. The resulting temperature and volume data were recorded to construct the ASTM distillation curve
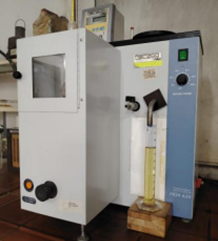
Figure 2. Representation of the ASTM Distillation Curve. Source: The Authors (2024)
Flash point
The flash point was estimated by filling the Cleveland cup with the liquid sample until the meniscus reached the reference mark. The sample was then heated at a rate of 2°C per minute while the flame was brought closer in a steady and uniform motion.
Kinematic Viscosity at 40°C
To measure the kinematic viscosity, 20 liters of distilled water were used. First, the time required for a specific volume of liquid to flow by gravity through a capillary tube into the viscometer was measured, ensuring a constant temperature of 40°C. The viscosity constant was then multiplied by the recorded time to obtain the viscosity value.
Color Analysis
The color analysis was performed by comparing the sample with standard patterns using a colorimeter. This allowed the evaluation of the liquid's purity and the detection of possible contaminants. Each of these tests contributed to the comprehensive characterization of the obtained product, providing essential data for its comparison with conventional fuels and for assessing its feasibility in practical applications.
2.2 Polystyrene (PS) pyrolysis processes in the laboratory
To identify the optimal parameters for the pyrolysis process, several tests were conducted at different operating temperatures: 300°C, 350°C, and 400°C, using a specialized laboratory reactor. These tests help determine which conditions yield the best performance. In each test, 100 g of polystyrene was weighed and introduced into the reactor, which was maintained at the desired temperature for 60 minutes. At the end of the process, the reactor was allowed to cool before the solid residue was extracted and weighed. The final mass was recorded to calculate the process yield in terms of the percentage of residual mass. This experimental approach facilitates the adjustment and improvement of the process to ensure maximum efficiency under real operating conditions. Additionally, by analyzing how yield varies with temperature, potential issues during process scaling can be predicted and resolved, ensuring its robustness and effectiveness in high-speed implementation.
Determination of Pyrolysis Parameters at Laboratory Scale
Below are the experimental data obtained at temperatures of 300°C, 350°C, and 400°C. These results provide information about the properties and behavior of materials exposed to different pyrolysis temperatures.
Test 1 - Analysis at 300 °C
The tests were conducted at a constant temperature of 300°C, using an initial mass of 110 g. The liquid volumes obtained showed slight variations, with recorded values of 82, 85, and 80 ml, averaging 82.3 ml and a standard deviation of 2.5 ml. The liquid density remained stable at 0.903 g/ml. The liquid mass ranged from 72.3 g, 79.4 g, and 75.9 g, with an average of 75.86 g and a standard deviation of 2.2 g. For the solid product, the generated mass fluctuated between 11.3 g, 14.6 g, and 14.5 g, with an average of 13.46 g and a standard deviation of 1.7 g. Finally, the gas mass produced varied between 12.7 g, 9.7 g, and 14.3 g, with an average of 12.23 g and a standard deviation of 2.9 g.
Test 2 - Analysis at 350°C
The experiments at 350°C showed liquid volumes ranging from 107, 109, and 104 ml, with an average of 106.66 ml. The liquid density remained constant at 0.908 g/ml. The liquid mass obtained fluctuated between 92.5 g, 98.4 g, and 90.7 g, giving an average of 93.86 g and a standard deviation of 2.1 g. Regarding the solid product, the generated mass varied between 5.3 g, 2.6 g, and 6.5 g, with an average of 4.8 g and a standard deviation of 1.2 g. Finally, the gas mass produced ranged between 3.5 g, 2.9 g, and 4.3 g, with an average of 3.56 g and a standard deviation of 1.0 g.
Test 3 - Analysis at 400 °C
Under conditions of 400°C, the liquid volumes obtained ranged from 109, 111, and 106 ml, with an average of 108.66 ml. The liquid density remained around 0.910 g/ml. The liquid mass varied between 97.4 g, 99.6 g, and 91.2 g, with an average of 96.06 g and a standard deviation of 1.9 g. Regarding the solid product, the generated mass ranged from 4.7 g, 3.0 g, and 5.1 g, with an average of 4.26 g and a standard deviation of 1 g. The gas mass produced varied between 0.4 g, 0.7 g, and 3.5 g, with an average of 1.53 g and a standard deviation of 1.1 g.
3. RESULTS AND DISCUSSION
The different performances obtained during the tests are shown in Figure 3. This graph provides a clear visual comparison of how different conditions affect the process performance.
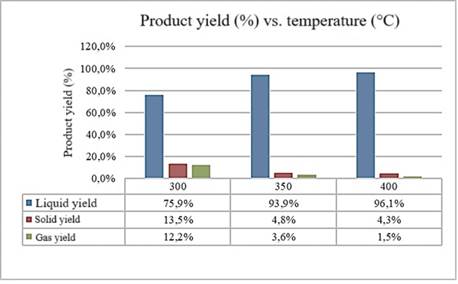
Figure 3. Performance at different temperatures. Source: Prepared by the authors (2024).
Table 1 summarizes the data from each pyrolysis process, used for a general characterization of the process, utilizing the average values obtained. It includes variables and results for each test, facilitating comparative analysis and the identification of patterns for a more detailed and accurate understanding of the process behavior under different experimental conditions.
Table 1. Pyrolysis process conditions
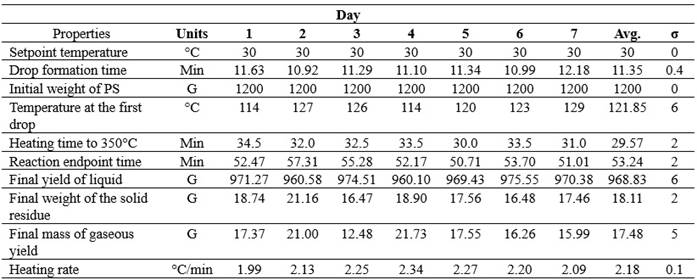
Source: Prepared by the authors (2024).
During the experiment, the initial temperature and initial weight of the PS remained constant on all test days, without any change in these initial conditions.
The curves presented in Figure 4 show a detailed picture of how the temperature changes with time during the pyrolysis process in each case examined.
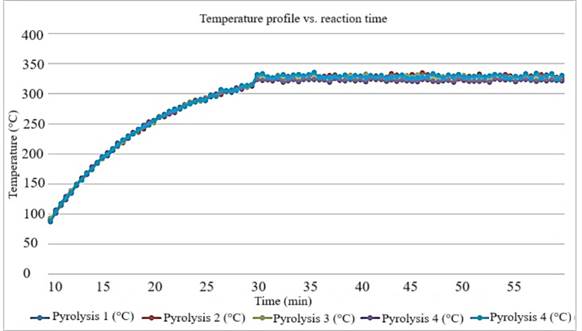
Figure 4. Profile Temperature in Pyrolysis tests VS reaction time.
Source: Prepared by the authors (2024).
Figure 5 shows the results of the mass balance of the products generated in the pyrolysis process, expressed in percentages. Details how final products are distributed based on their mass.
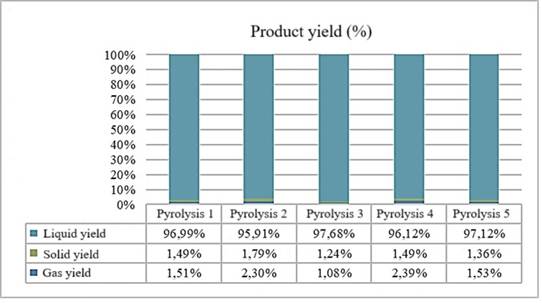
Figure 5. Efficiencies of each Pyrolysis. Source: Prepared by the authors (2024).
The amount of alternative fuel produced from the collected polystyrene is estimated, we find that around 10.2 L of this fuel are produced per day and the monthly production is approximately 225L.
3.1 Distillation of the Alternative Fuel
ASMT Distillation
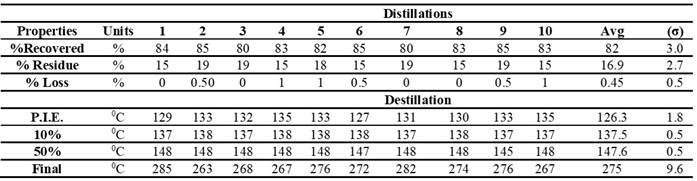
The results obtained show variability but remain stable in terms of recovery percentage, residues, and losses during distillation. The recovery percentage ranged from 80% to 85%, suggesting reasonable consistency in product recovery. Residue percentage ranged from 15% to 19%, reflecting slight differences in the amount of residue left after the process.
Losses remained low, with values between 0% and 1%, indicating good control of losses during distillation. Regarding characteristic boiling points (BWP), the results showed greater variability. The initial boiling point (IBP) ranged between 127°C and 135°C. Boiling points at percentiles (10%, 50%) and the final boiling point exhibited variations, with averages of 137.5°C, 147.6°C, and 275°C, respectively, and adjusted standard deviations of 0.5°C.
The data in Table 2 detail the basic properties obtained from five steps of the second distillation of the product derived from the first distillation of the pyrolytic oil. Losses were low, ranging from 0% to 1%, with an average of 0.45%, suggesting effective control of these losses.
Table 2. Estimation of Fuel Generated from Recycled PS
Source: Prepared by the authors (2024).
To evaluate the composition and thermal properties of the product compared to traditional fuels such as diesel and gasoline, it is crucial to compare the ASTM distillation curve of the liquid product with the distillation curves of diesel and gasoline. This comparison can be observed in Figure 6. The graph highlights significant similarities and differences between the distillation profiles of each substance.
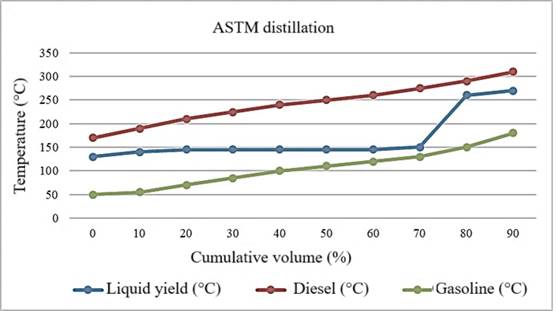
Figure 6. Comparison of ASTM Distillation Curves. Source: Prepared by the authors (2024).
3.2 Characterization tests
API and Specific Gravity
A comprehensive API density analysis and adjusted specific gravity calculations were performed for each pyrolysis test. These data are essential for understanding the physical and chemical properties of the product created during this thermochemical process. The API gravity measures the relative density of liquid hydrocarbons compared to water, providing key information about their specific density and ability to float or sink. Specific gravity, corrected to a standard temperature, allows for consistent comparisons between different samples.
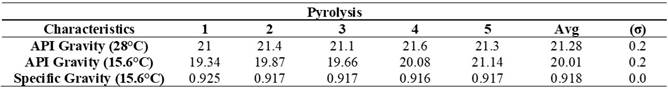
Table 3 presents the API gravity and specific gravity values of the product obtained at different temperatures. The API gravity results at 28°C range from 21 to 21.6, indicating considerable stability in relative density compared to water at this standard temperature. On the other hand, the API gravity at 15.6°C ranges from 19.34 to 21.14, suggesting greater variability in density at lower temperatures, affecting properties such as fluid behavior. Specific gravity, also calculated at 15.6°C, shows consistently close values, highlighting high precision and stability in measuring the product's density.
Table 3. API Gravity and Specific Gravity of the Product
Source: Prepared by the authors (2024).
Kinematic viscosity measured at 40°C
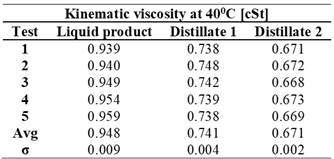
The kinematic viscosity values obtained at 40°C allow for an analysis of the fluid's flow behavior under specific conditions, providing key information about its performance in industrial and commercial applications. These results reveal notable differences between the initial liquid product and the distillates obtained. Table 4 shows that the liquid product has higher viscosity values. In comparison, distillates 1 and 2 exhibit lower viscosities and reduced standard deviations, reflecting their improved fluidity.
Table 4. Kinematic Viscosity Results.
Source: Prepared by the authors (2024).
Flash Point
The flash point, a crucial property for evaluating fuel safety and handling, was analyzed using the Cleveland open cup method. The liquid sample was poured into the container up to the reference mark and heated at a constant rate of approximately 2°C per minute. During heating, a test flame was uniformly applied until the moment when the emitted vapors formed a flammable mixture upon contact with air.
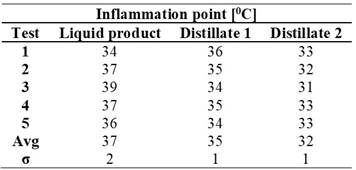
The results indicated that the initial fuel had a flash point range between 34°C and 39°C, with an average of 37°C (Table 5). In contrast, the distillates obtained after the refining process showed lower values: the first distillate averaged 35°C, while the second recorded 32°C. This suggests that the distillation process not only affects the chemical composition but also the product's volatility, making the distillates more susceptible to ignition compared to the original liquid.
Table 5. Kinematic viscosity results
Source: Prepared by the authors (2024).
Water and Sediment Content
The water and sediment content in the liquid product was evaluated to determine its purity and potential impact on practical applications. The analysis was conducted following established standards, using a centrifugation procedure. Two 50 ml samples were prepared and combined with an appropriate solvent in centrifuge tubes. After agitating the samples to ensure a homogeneous mixture, the tubes were centrifuged at 1300 rpm and 60°C for 15 minutes.
The results indicated that the total water and sediment content in the liquid fuel was less than 0.05%. This low concentration of impurities enhances fuel performance by reducing the risk of clogging in injection systems and minimizing wear on mechanical components.
In additional tests, the distillate obtained was blended with diesel in proportions of 9.5% and 90.5%, respectively. This mixture met technical specifications, achieving a flash point of 56.3°C. This value, higher than the flash point of the initial liquid product, represents an improvement in fuel safety during storage and handling, as it reduces the risk of fires or explosions. The low proportion of sediment and water also ensures more efficient performance in combustion engines.
ASTM Color
The ASTM color analysis revealed that the first distillate has a value of 1.5 ASTM units, while the second distillate registers a value below 0.5 ASTM units. These results indicate that the second distillation is significantly cleaner than the first, suggesting higher purity and a lower presence of impurities or contaminants. This is advantageous for applications requiring high-quality fuels.
3.3 Comparison of Results with Other Fuels
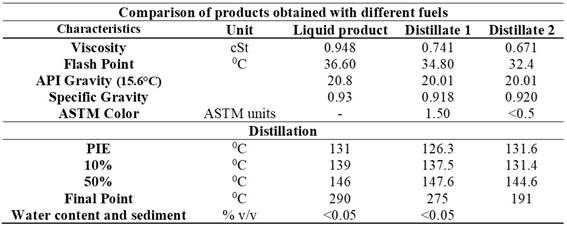
The results of the comparison, detailed in Table 6, show clear differences in several key properties between the original liquid product and the two distillates obtained. The viscosity of the liquid product is 0.948 cSt, whereas distillates 1 and 2 have lower viscosities of 0.741 cSt and 0.671 cSt, respectively. These differences suggest that the distillation process reduces flow resistance, potentially making the product easier to handle in various applications.
Table 6. Comparison of Fuel Products.
Source: Prepared by the authors (2024).
3.4 Comparison of the Sample with Commercial Fuel Properties
Comparative Analysis of API Gravity
API gravity, which measures the relative density of liquid fuels compared to water, is a fundamental parameter for evaluating their performance in practical applications. In this study, the API gravity values of the pyrolysis products were compared with the standards of traditional fuels like diesel and gasoline.
The results show that gasoline, with an API gravity of 55.30°C, is significantly less dense than diesel, which has an average of 35.34°C. In contrast, the liquid product from pyrolysis has a much higher density, with an average API gravity of 20.8°C. The distillates obtained from the process show similar values, around 20.01°C.
These differences indicate that fuels obtained through pyrolysis are denser than conventional commercial fuels. This suggests that they may have a higher energy content per unit volume, although they could also influence certain combustion characteristics. The API gravity analysis highlights that these products possess distinctive physical properties that must be considered when evaluating their viability as alternative fuels or additives in blends with other hydrocarbons.
Comparative Analysis of Specific Gravity
The density values obtained from pyrolysis were compared with standard values for diesel and gasoline fuels. Diesel has a specific gravity of 0.835, while gasoline has a specific gravity of 0.74. In contrast, the liquid pyrolysis product has a density of 0.93, and distillates 1 and 2 have values of 0.918 and 0.92, respectively.
Specific gravity measures the relative density of a liquid compared to water, where higher values indicate greater density. Gasoline, with a density of 0.74, is less dense than diesel, at 0.835. On the other hand, the liquid products obtained through pyrolysis have higher density values (0.93 for the liquid product and between 0.918 and 0.92 for distillates 1 and 2), indicating they are denser than conventional fuels.
The pyrolysis product has a higher density than the two fuels mentioned. Regarding its potential use compared to the commercial fuels listed in the table, if the pyrolysis product exhibits other suitable properties, such as viscosity, flash point, and energy content similar to those fuels, its use can be considered as a fuel or additive. However, its higher density may reflect differences in combustion characteristics or energy content, which should be considered when evaluating its feasibility as an alternative commercial fuel.
The viscosity results of the pyrolysis product are compared with the typical values for diesel and gasoline fuels. The kinematic viscosity of diesel generally ranges from 2.0 to 4.5 cSt, while that of gasoline is significantly lower, between 0.6 and 0.9 cSt. In comparison, the liquid products obtained from pyrolysis have viscosities of 0.948 cSt for the liquid product and 0.741 cSt and 0.671 cSt for distillates 1 and 2, respectively.
Viscosity is a key parameter for determining the flow and fluidity of a fuel. It has been found that diesel has a moderate viscosity, while gasoline is significantly less viscous. The products obtained from pyrolysis have a viscosity lower than that of diesel but slightly higher than that of gasoline. This suggests that they may be suitable for some industrial and commercial applications.
Comparative Flash Point Analysis
The flash point results are compared with typical values for fuels such as diesel and gasoline. In general, diesel has a flash point of around 74°C, while gasoline has a much lower flash point, around 48.5°C. The liquid products obtained from pyrolysis have flash points of 36.6°C for the liquid product and 34.8°C and 32.4°C for distillates 1 and 2, respectively.
The flash point is crucial for determining the minimum temperature at which a liquid can emit enough vapor to form a flammable mixture with air. Diesel has a higher flash point, indicating greater resistance to ignition compared to gasoline. At the same time, pyrolysis products have lower flash points than diesel but slightly higher than gasoline, suggesting lower resistance to ignition.
Comparative ASTM Distillation Analysis
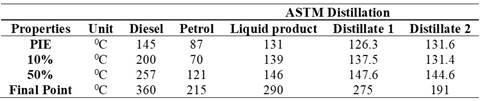
The comparative ASTM distillation analysis reveals how the pyrolysis results align with typical distillation values for diesel and gasoline. According to Table 7, diesel has higher initial and final points (PIE: 145°C, final point: 360°C) compared to gasoline (PIE: 87°C, final point: 215°C), indicating a higher percentage of heavier components.
On the other hand, the pyrolysis products have initial and final points (PIE: 131°C, final point: 290°C) lower than diesel but slightly higher than gasoline, suggesting a lighter composition.
Table 7. ASTM Distillation Comparison of Pyrolysis Product with Commercial Fuels like Diesel and Gasoline
Source: Producted by the authors (2024).
CONCLUSIONS
The data from the analyses reveal a clear relationship between the pyrolysis temperature and the process yield. At 300°C, a yield of 85% was achieved, indicating that a large portion of the polystyrene was converted into pyrolysis products. This high yield suggests that the pyrolysis process is effective in the initial breakdown of polystyrene at relatively low temperatures. However, when the temperature increases to 350°C, the process yield drops to 80%. This reduction could be associated with the volatilization of intermediate products generated during pyrolysis, which are lost as gases or vapors at higher temperatures.
The loss of these volatile compounds may result in a greater mass loss, negatively affecting the overall yield of the process. When the temperature increases to 400°C, the process yield further decreases to 75%. This decline indicates that, at higher temperatures, polystyrene decomposes more completely, producing a greater amount of gases and liquids that are lost. Although the conversion of the material is more thorough, the greater mass loss can reduce the process efficiency in terms of producing recoverable solids.
Polystyrene pyrolysis proves to be an effective method for converting plastics into fuels, though its efficiency varies with the operating temperature. At lower temperatures, the yield is higher, while at higher temperatures, mass loss increases, suggesting the need to adjust and optimize process conditions. The characteristics of the produced fuel vary according to the pyrolysis temperature, influencing its fluidity and stability. At lower temperatures, the fuel tends to be lighter and more fluid, while at higher temperatures, the viscosity increases, which may limit its use in some applications.
Polystyrene pyrolysis could be a viable alternative for plastic waste management and fuel generation.
REFERENCES
Angulo & Carrera (2023) Obtención De Combustible Líquido, Mediante El Proceso De Pirólisis A Partir De Residuos Plásticos. Universidad Politécnica Salesiana. https://dspace.ups.edu.ec/bitstream/123456789/26153/1/UPS-GT004648.pdf
Castro, P. (2024, noviembre 12) Energy policy implications of Ecuador´s NDC. Journal of Infrastructure, Policy and Development 2024, 8(13), 7542. https://doi.org/10.24294/jipd7542
EP PETROECUADOR. (2022, marzo 25). https://www.eppetroecuador.ec/?p=12532#:~:text=Para%20abastecer%20la%20demanda%20de,de%20hidrocarburos%20a%20escala%20nacional
Espinoza, S. (2022) Energy Transition Scenarios for Fossil Fuel Rich Developing Countries under Constraints on Oil Availability: The Case of Ecuador. Energies. https://doi.org/10.3390/en15196938
Hernández, C. (2009, enero). https://www.scielo.org.mx/scielo.php?script=sci_arttext&pid=S1405-77432012000300004
INSST (2018). Fichas Internacionales de Seguridad Química (ICSCs). https://chemicalsafety.ilo.org/
Kwakwa, V., & Alfonso, G. (2021, abril 6). Banco Mundial Blogs. https://blogs.worldbank.org/es/voices/residuos-plasticos-crecienteamenaza-y-oportunidad-desperdiciada
Machado, P. Araujo, M. Torres, L. Oliveira, J. Walter, A. (2015, abril 5). The use of socioeconomic indicators to assess the impacts of sugarcane production in Brazil. Renewable and Sustainable Energy Reviews. Volume 52, December 2015, Pages 1519-1526. https://doi.org/10.1016/j.rser.2015.07.127
Marimon, K. J. (2022). Universidad Antonio Nariño. https://repositorio.uan.edu.co/server/api/core/bitstreams/f1634e9a-9111-43ec-a0d6-7b3ae195cf48/content
Miandad, B. (2017). Effect of plastic waste types on pyrolysis liquid oil. International Biodeterioration and Biodegradation, 119, 239–252.
Mohamed. (2017). Fourier Transform Infrared (FTIR) Spectroscopy. https://www.sciencedirect.com/science/article/pii/B9780444637765000012
Nuñez, N. (2019). Escuela Superior Politécnica de Chimborazo. http://dspace.espoch.edu.ec/bitstream/123456789/13104/1/96T00552.pdf
Ortega-Pacheco, D. (2021) Social and Economic Contribution of the Bioeconomic Sector in Ecuador: A Methodological Approach. https://doi.org/10.1007/978-981-15-7321-7_3
Pinargote Bravo, L., & Sánchez Muñoz, Y. (2023, febrero). Escuela Superior Politécnica.
RACE. (2022, septiembre 28). https://www.race.es/poder-calorifico-y-otroscombustibles
Rojas, A. (2012). Efecto de la velocidad de calentamiento y la biomasa en la cinética. http://bdigital.unal.edu.co/51518/7/9789587610321.pdf
Salinas, V., & Vázquez, F. (2010). Diseño y construcción de un sistema de combustión para la caracterización térmica de desechos plásticos utilizados como combustible alternativo. Sangolquí.